| Expiration (Joke Date) |
Joke Raised On (Pull Date) |
DTE | Ticker | Signal | Direction | Target / Range |
Prediction (Joke) | Outcome (Real) | Hit % | Status |
|---|---|---|---|---|---|---|---|---|---|---|
| Click Extract New to load predictions from options data. | ||||||||||
By Signal Type
| No data |
By Symbol
| No data |
By GEX Regime
| No data |
By Human Scenario
| No data |
By Knowledge Source
| No data |
By GEX × DEX
| No data — re-extract predictions to populate DEX |
By Trade Structure
| No data |
Understanding Prediction Scoring — signal types, validation rules, and how hit rates are computed click to expand
How the Predictions table relates to the Pattern engine
The Predictions table on this tab is the historical record of every
Pattern firing the system has produced — one row per
What the engine does with this data:
• Hit rate per signal_type drives the learned weight applied to that Pattern in confluence:
• Achievement % (mapped to 0 / 0.5 / 1.0 from failed / partial / achieved) is the training target for the per-pattern XGBoost regressor, when one exists. The model adds context-aware refinement to Signal.strength on top of the scalar weight.
• Statistics tab tables auto-populate as new Pattern types accumulate predictions — no UI change needed when you ship a new detector.
(ticker, expiration, pull_date, signal_type). Each
signal_type here corresponds 1:1 to a registered
pattern_id in the engine's Pattern Registry; see the
Brain Architecture section on the Judgement Criteria tab for the
full pipeline (Pattern → Signal → Prediction).What the engine does with this data:
• Hit rate per signal_type drives the learned weight applied to that Pattern in confluence:
multiplier = clamp(hit_rate / 0.5, [0.3, 2.0]). A
predictor at 70% hit rate gets a 1.4× weight; one at 20% gets
0.4×. Adjustments are stored in
data/ontology.db.adjustments with lineage back to the
predictions that drove them.• Achievement % (mapped to 0 / 0.5 / 1.0 from failed / partial / achieved) is the training target for the per-pattern XGBoost regressor, when one exists. The model adds context-aware refinement to Signal.strength on top of the scalar weight.
• Statistics tab tables auto-populate as new Pattern types accumulate predictions — no UI change needed when you ship a new detector.
New patterns awaiting historical data
Six strike-zone Δ patterns ship in the registry but have no
predictions yet because the Δ matrix backfill is still pending. Once
the post-market cycle starts emitting them, they will appear in the
Statistics tables and accumulate hit rates like any other Pattern:
Each detects day-over-day OI movement at strike zones (FAR_BELOW … FAR_ABOVE relative to spot). They run on the registry's default weights until enough outcomes accumulate; then the weight learner promotes/dampens them automatically.
mm_sell_put_high · big_call_high ·
sudden_put_low · call_accum_atm ·
call_unwind_high · put_unwind_lowEach detects day-over-day OI movement at strike zones (FAR_BELOW … FAR_ABOVE relative to spot). They run on the registry's default weights until enough outcomes accumulate; then the weight learner promotes/dampens them automatically.
How predictions are validated
Each prediction is automatically validated against actual OHLCV price data between the
pull date (when the signal was generated) and the expiration date.
The validator computes an achievement percentage (0–100%) based on signal-specific
rules, then maps it to a status:
≥ 80% → ✅ Achieved
20–79% → 🟡 Partial
< 20% → ❌ Failed
No data → ⬜ Open (expiration not yet passed, or price data unavailable)
Hit Rate = (Achieved + Partial × 0.5) ÷ Validated × 100%. Partial signals count as half a hit. Open predictions are excluded from the denominator.
≥ 80% → ✅ Achieved
20–79% → 🟡 Partial
< 20% → ❌ Failed
No data → ⬜ Open (expiration not yet passed, or price data unavailable)
Hit Rate = (Achieved + Partial × 0.5) ÷ Validated × 100%. Partial signals count as half a hit. Open predictions are excluded from the denominator.
What is DTE?
DTE (Days to Expiration) = expiration_date − pull_date, in calendar days.
0DTE means the signal was extracted on expiration day itself — the prediction
must be validated against that single trading session. Higher DTE gives more time
for the signal to play out, so hit rates often differ by DTE.
The Statistics table shows hit rates broken out by DTE (0–9) so you can see which time horizons each signal type performs best at.
The Statistics table shows hit rates broken out by DTE (0–9) so you can see which time horizons each signal type performs best at.
Signal: Price Range (RANGE ↔)
Predicts that price will stay within a $low – $high band during the validation period.
Validation rules:
• Touched = price came within 0.3% of a bound (e.g., period high ≥ $high × 0.997)
• Range break = price exceeded a bound by more than 0.3% (broke below low or above high)
• Days in range = count of days where the full bar [low, high] stayed within the range (± 0.3% tolerance)
Scoring:
• Both bounds touched, no break → 100% (achieved)
• One bound touched, no break → 50–100% based on gap to the other bound
• Range broken but held ≥ 60% of days → partial (in_range% × 0.5)
• Range broken, held < 60% of days → failed (in_range% × 0.3)
• Neither bound reached → 0–10% based on gap
Validation rules:
• Touched = price came within 0.3% of a bound (e.g., period high ≥ $high × 0.997)
• Range break = price exceeded a bound by more than 0.3% (broke below low or above high)
• Days in range = count of days where the full bar [low, high] stayed within the range (± 0.3% tolerance)
Scoring:
• Both bounds touched, no break → 100% (achieved)
• One bound touched, no break → 50–100% based on gap to the other bound
• Range broken but held ≥ 60% of days → partial (in_range% × 0.5)
• Range broken, held < 60% of days → failed (in_range% × 0.3)
• Neither bound reached → 0–10% based on gap
Signal: Pin Strike
Predicts that price will close near a specific strike on expiration day,
drawn to it by dealer gamma hedging (the "pinning effect").
Validation: compares the expiration-day closing price to the target strike. Only the final close matters — intraday moves are irrelevant.
Scoring (by gap %):
• ≤ 0.3% gap → 100% "pinned"
• ≤ 1.0% gap → 80% "near-pin"
• ≤ 2.0% gap → 60% "close"
• ≤ 5.0% gap → 30% "partial"
• > 5.0% gap → 0% "miss"
Validation: compares the expiration-day closing price to the target strike. Only the final close matters — intraday moves are irrelevant.
Scoring (by gap %):
• ≤ 0.3% gap → 100% "pinned"
• ≤ 1.0% gap → 80% "near-pin"
• ≤ 2.0% gap → 60% "close"
• ≤ 5.0% gap → 30% "partial"
• > 5.0% gap → 0% "miss"
Signal: Trapdoor
A negative-GEX strike where dealer hedging amplifies moves. If price breaks
through this level, the feedback loop (dealers sell → price drops → dealers sell more)
should cause a sustained move below the target.
Validation checks:
• Did price break below the target at any point?
• Did price close below target for 2+ consecutive days?
Scoring:
• Breach + 2+ consecutive closes below → 100% (trapdoor sprung)
• Breach but did not sustain → 70% (partial breach)
• Came within 0.5% but no breach → 50%
• Did not reach target → 0–40% based on gap
Validation checks:
• Did price break below the target at any point?
• Did price close below target for 2+ consecutive days?
Scoring:
• Breach + 2+ consecutive closes below → 100% (trapdoor sprung)
• Breach but did not sustain → 70% (partial breach)
• Came within 0.5% but no breach → 50%
• Did not reach target → 0–40% based on gap
Signal: P/C Ratio (Unusual Put/Call)
Flags an abnormally high or low put/call ratio, suggesting directional
bias. A very high PCR suggests bearish positioning; very low suggests bullish.
Validation: measures the total % move from pull date close to expiration close, then checks if it aligned with the predicted direction.
Scoring (by total move %):
• Move > 3% in predicted direction → 100%
• Move 1–3% in predicted direction → 70%
• Move < 1% either way → 30% (neutral — neither confirmed nor denied)
• Move > 1% in opposite direction → 0%
Validation: measures the total % move from pull date close to expiration close, then checks if it aligned with the predicted direction.
Scoring (by total move %):
• Move > 3% in predicted direction → 100%
• Move 1–3% in predicted direction → 70%
• Move < 1% either way → 30% (neutral — neither confirmed nor denied)
• Move > 1% in opposite direction → 0%
Signal: GEX Flip
Identifies the GEX flip point — the strike price where net gamma exposure
changes sign (positive → negative or vice versa). Price above the flip is in a
stabilizing regime; below is in an amplifying regime.
Validation: counts what % of trading days price closed on the predicted side of the flip point.
Scoring (by % days on predicted side):
• ≥ 70% of days → 100%
• 50–69% of days → 60%
• < 50% of days → 0%
Validation: counts what % of trading days price closed on the predicted side of the flip point.
Scoring (by % days on predicted side):
• ≥ 70% of days → 100%
• 50–69% of days → 60%
• < 50% of days → 0%
Signal: Delta Position
Tracks market maker aggregate delta positioning on the option chain delta curve.
Position delta > 0.65 means dealers are at max call exposure (bearish signal —
less fuel to push higher). Position delta < 0.35 means dealers are put-exposed
(bullish signal — upside amplification if support holds).
Validation: directional — did price move in the predicted direction?
Scoring:
• Move > 2% in predicted direction → 100%
• Move 1–2% in predicted direction → 70%
• Move < 1% in predicted direction → 30%
• Move in opposite direction → 0%
Validation: directional — did price move in the predicted direction?
Scoring:
• Move > 2% in predicted direction → 100%
• Move 1–2% in predicted direction → 70%
• Move < 1% in predicted direction → 30%
• Move in opposite direction → 0%
Signal: Cross-Asset Regime
Classifies the daily market environment from SPY × VIX × GLD price direction
(8 regimes: risk-on, reflation, melt-up, nervous, fear, crisis, dip, complacent).
Checks whether it is a broad risk-on move, a crisis, or a fragile rally.
Validation: directional — did the market follow the regime bias?
Scoring: same as Delta Position (2%/1% thresholds).
Validation: directional — did the market follow the regime bias?
Scoring: same as Delta Position (2%/1% thresholds).
Signal: Breadth Signal
Timing signals from market breadth velocity (% of sectors above 20-day SMA)
and VIX crossings. Detects breadth thrust (broad buying), collapse (broad selling),
VIX buy signals (panic fading), and divergences (narrow rally or stealth recovery).
Validation: directional — did price move in the signal direction?
Scoring: same as Delta Position (2%/1% thresholds).
Validation: directional — did price move in the signal direction?
Scoring: same as Delta Position (2%/1% thresholds).
Feature: Positive Gamma Region (+γ Zone) & Gamma Support Reclaim (SP-1)
The zone between the GEX flip strike and +GEX#1 (top positive gamma level).
When price is inside this region, dealers are long gamma — they mechanically buy dips
and sell rallies, creating a stabilizing floor. This is the “safe zone” for dip-buying.
Key fields:
•
•
•
•
Trading implication:
Key fields:
•
posGammaRegion (bool) — True when price is between flip and +GEX#1•
posGammaRegionWidthPct (%) — zone width. Narrow=compressed spring, Wide=gentle magnet•
posGammaRegionPosition (0–1) — 0=at flip edge, 1=at +GEX#1 (top)•
gammaSupportReclaim (bool) — SP-1 composite pattern: in +γ zone near floor + ≥2 confirms
(greeks aligned, gamma squeeze, concentrated GEX, near flip)Trading implication:
posGammaRegion = spatial awareness (where is price?).
gammaSupportReclaim = actionable signal (high-conviction reversal entry).
Bearish trades fight dealer hedging in the +γ zone.Status mapping summary
| Achievement % | Status | Hit Rate Weight |
|---|---|---|
| ≥ 80% | ✅ Achieved | 1.0 |
| 20–79% | 🟡 Partial | 0.5 |
| < 20% | ❌ Failed | 0.0 |
| — | ⬜ Open | excluded |
Brain Architecture — how the engine reasons
Pipeline
Every prediction comes from one canonical pipeline that can be inspected
and audited end-to-end. The same
Prediction object is what
the Predictions tab displays, what the Statistics tab aggregates, and
what consuming pages render — there is no separate scoring path.
| Layer | What it does | Where to look / what to expect |
|---|---|---|
| 1. Pattern Registry | 28 stateless detectors across 8 categories — GEX state, OI flow,
trade structure, gamma, dealer, macro, IV skew, strike-zone Δ.
Each Pattern is one regularity in OI/Volume/Price/IV data and emits
a Signal with direction + strength when it fires. |
Catalog rendered live in the Signal-Type filter above (grouped
by category). The same catalog is served by
GET /api/patterns. Adding a Pattern in
engine/patterns/detectors/ auto-surfaces it on this
page — no HTML change ever. |
| 2. Brain Assessment | Classifies regime case (1–7), GEX×DEX trend, dealer mechanics, P/C ratio, position-delta zone, cross-asset regime, breadth. Same assessment used by every consumer. | intelligence/assess.py:PythonBrain.assess_market.
Output flows into the regime and
structure fields of every Prediction. |
| 3. Confluence | Per-direction weighted score:score(d) = Σ weight[pid] × strength over Signals
with direction d. The dominant side becomes the
Prediction direction; confidence is the diminishing-returns
transform of its score capped at 5. |
intelligence/predict.py:predict(). Confidence is the
continuous form; the table here floors it to integer 1–5 for
display. |
| 4. Learned Weights | Each Pattern's weight is tuned from historical
hit rate. multiplier = clamp(hit_rate / 0.5, 0.3, 2.0)
so reliably-predictive patterns weigh more, anti-predictive ones
less. Every weight change is an Adjustment Object with full
lineage to its source predictions. |
pipeline/pattern_learner.py writes to
data/ontology.db.adjustments. Loader:
intelligence/weights.load_active_pattern_weights().
Inspect: SELECT * FROM adjustments WHERE target_kind='signal.weight'. |
| 5. Per-Pattern Models | For patterns with enough samples, an XGBoost regressor predicts
an achievement score (0..1) from contextual scalars. Model output
blends multiplicatively into Signal.strength —
refined = strength × (0.5 + model_score) — so model
and detector must agree to reach high strength. |
data/models/per_pattern/<pattern_id>.pkl +
.json metadata (n_samples, R², feature_names).
Loaded lazily by
intelligence/per_pattern_predictor.score_pattern().
Patterns without a model run unchanged. |
| 6. Change-to-Change Feedback | Every Adjustment has a measured_lift Function:
after the lift window elapses, compare pre-window hit rate to
post-window hit rate. The lift number is itself training signal —
"did this weight change help or hurt?" — for the next round of
adjustments. |
pipeline/lift_evaluator.py. Writes
EvaluateAdjustmentLift Actions linked back to the
source PerformAdjustment Action. |
Read this page top-to-bottom to understand the engine; the
sections below document each Pattern's detection thresholds, validation
rules, and judgement criteria. Those are still authoritative — Layer 1
reads them, Layer 4 tunes their weights, Layer 5 trains a model on top
of them. Nothing replaces them; the engine just measures and adapts.
GEX Regime Classification — 7 Cases
Engine (Black-Scholes)
Deterministic classification from Net GEX sign + price vs flip + proximity to max gamma.
| Case | Net GEX | Price vs Flip | Regime | Trading Implication |
|---|---|---|---|---|
| 1 | Either | Near Max G | Pinned at Max Gamma | Tightest action. Sell premium. Don’t chase breakouts. |
| 2 | Either | Within ~1.5% | Price near Flip | Regime boundary. High uncertainty. Watch next candle with volume. |
| 3 | Positive | Above | +GEX · Above Flip | Stabilizing. Mean-revert. GEX levels = reliable S/R. |
| 4 | Positive | Below | +GEX · Below Flip | Transitional. Wait for flip reclaim before longs. |
| 5 | Negative | Above | -GEX · Above Flip | Fragile. Rallies are selling opportunities. Flip = last dam. |
| 6 | Negative | Below | -GEX · Below Flip | Full amplifying. Trend-follow only. -GEX = trapdoors. |
| 7 | Negative | N/A | -GEX · No Flip | Extreme. No structural support. Stand aside or trade tiny. |
GEX Distribution Structures — 12 Patterns (S1–S12)
Human Reference
New — not in engine
Sub-classification within the 7 regime cases. Identifies the specific GEX distribution shape based on: % negative gamma, concentration (HHI), price vs flip, and number of dominant piles. Each structure predicts end-of-day price behavior.
| 1 | [1, 3] | +GEX Above Flip, Concentrated Single | Price closes away from peak; largest strike = resistance | high |
| 2 | [3] | +GEX Above Flip, Concentrated 2-3 | Price stays in range below/between large strikes | high |
| 3 | [3, 5] | +GEX Above Flip, Scattered Negative Below | Price above negative strikes; flip = support | medium |
| 4 | [2, 3] | +GEX Above Flip, Mixed Wide | Price bounded by opposing piles | medium |
| 5 | [2, 4] | +GEX Below Flip, Wide Scatter | Price between significant neg/pos piles | medium |
| 6 | [6] | -GEX Below Flip, Concentrated Single | Price closes at biggest pile; pile = S/R | high |
| 7 | [6, 7] | -GEX Below Flip, Scattered | Price tests piles; accelerates away from largest | low |
| 8 | [6] | -GEX Below Flip, Moderate Concentration | Price at/below biggest neg pile; piles = S/R | medium |
| 9 | [4] | -GEX Below Flip, Transitioning Positive | Price chases piles + flip; recovering | medium |
| 10 | [5] | -GEX Above Flip, Dominant Above | Piles = resistance; break below → cascade | high |
| 11 | [5] | -GEX Above Flip, Dominant Below Price | Pushed away from pile; break above → accelerate | high |
| 12 | [2, 5] | -GEX Above Flip, Multiple Large Piles | Close between largest neg/pos piles | medium |
GEX Asymmetry / Mean-Reversion Rule
Human Reference
New — not in engine
When both +GEX and -GEX clusters exist, the relative magnitude determines directional bias.
| Condition | Expected Move | Rationale |
|---|---|---|
| |−GEX| > |+GEX| | Price moves toward +GEX (upward) | Heavier negative positioning creates gravitational pull toward the positive cluster. |
| |+GEX| > |−GEX| | Price moves toward −GEX (downward) | Heavier positive positioning creates gravitational pull toward the negative cluster. |
This rule applies specifically to mixed +/-GEX environments (Scenario 6).
Signal Validation Rules — 10 Types
Engine (Black-Scholes)
How each prediction signal type is scored after expiration.
| Signal | Trigger | 100% (Achieved) | 60–80% (Partial) | 0% (Failed) |
|---|---|---|---|---|
| Pin Strike | Max gamma strike exists | Close ≤0.3% from target | Close ≤2% from target | Close >5% from target |
| Price Range | Two GEX zones ≥0.5% gap | Both bounds touched, price stayed in range | One bound reached; partial penetration | Neither bound reached |
| Trapdoor | Net GEX < 0 + flip below spot | Breach + 2+ consecutive closes below | Brief break but didn’t sustain | Never breached target |
| P/C Ratio | P/C OI > 2.5 or < 0.45 | >3% move in predicted direction | >1% move | Move <1% or wrong direction |
| GEX Flip | Flip within 3% of spot | ≥70% days on predicted side | ≥50% days | <50% days on predicted side |
| GEX×DEX | Both net_gex and net_dex computed | >3% move in predicted direction | >1% move | Move <1% or wrong direction |
| Gamma Squeeze | 2+ expirations have DEX/GEX/VEX peaks at same strike zone | >5% move in predicted direction (multi-tenor squeeze) | >3% move | Move <1% or wrong direction |
| Dealer Delta | Position delta > 0.65 (bearish) or < 0.35 (bullish) | >2% move in predicted direction | >1% move | Move in opposite direction |
| Cross-Asset Regime | SPY×VIX×GLD daily direction → regime with bullish/bearish bias | >2% move in regime bias direction | >1% move | Move in opposite direction |
| Breadth Signal | Breadth thrust/collapse, VIX crossing, or divergence detected | >2% move in signal direction | >1% move | Move in opposite direction |
| IV Skew | Put wing IV - call wing IV > 5pp (bearish) or call > put by 5pp (bullish) | >2% move in skew-predicted direction | >1% move | Move in opposite direction |
| Gamma Wall | Single strike GEX > 4× average (extreme concentration) | Price closes within 0.5% of gamma wall at expiration (pin), or >3% move through (trapdoor) | Price closes within 2% of wall | Price ignores wall entirely |
Gamma Squeeze — Cross-Tenor Convergence
Human Reference
New — not in engine
When 2+ expirations all have DEX/GEX/VEX peaks converging at the same strike zone, dealer hedging pressure compounds across the entire expiration chain. Each expiration independently creates delta/gamma/vanna hedging demand at the same strike, and a catalyst triggers simultaneous hedging cascades across ALL tenors. This is far stronger than single-expiration convergence because: (1) aggregate OI at the convergence strike is multiplied, (2) dealers must hedge each expiration independently, so hedging flows stack, (3) IV changes (vanna) propagate across the term structure.
| 2+ expirations, all positive, consensus bullish | Strong bullish multi-tenor squeeze — catalyst triggers cascading buying across all expirations | Each expiration’s positive exposure forces independent dealer buying. Flows compound at the convergence strike. |
| 2+ expirations, all negative, consensus bearish | Strong bearish multi-tenor squeeze — catalyst triggers cascading selling | Negative exposure across multiple tenors means amplification on every expiration. Downside acceleration compounds. |
| 4+ expirations converging | Very strong signal — entire option chain is structurally loaded at one strike | With 4+ expirations, the strike zone becomes a massive hedging magnet. Any significant catalyst can produce explosive moves. |
| Mixed directions across expirations | High instability — expect outsized volatility near the convergence strike | Even with mixed signals, the sheer concentration of exposure across tenors means any strong move will be amplified. |
Put/Call Ratio Interpretation
Industry Standard
Aggregate P/C ratio from OI measures market positioning sentiment.
| P/C OI Ratio | Reading | Implication |
|---|---|---|
| > 2.5 | Extreme put-heavy | Bearish positioning; potential short squeeze / capitulation |
| 1.5 – 2.5 | Moderately bearish | Hedging demand elevated; caution warranted |
| 0.7 – 1.5 | Neutral | Balanced; no strong directional signal |
| 0.45 – 0.7 | Moderately bullish | Call-heavy; upside positioning |
| < 0.45 | Extreme call-heavy | Bullish positioning; potential blow-off top risk |
Dealer Hedging Mechanics
Industry Standard
Market makers hedge options they sell. Their behavior creates mechanical price effects predictable from gamma exposure.
| Dealer Position | Hedging Behavior | Price Effect |
|---|---|---|
| Long Gamma (+GEX) | Buy when price falls, sell when price rises | Stabilizing — dampens moves, range-bound action |
| Short Gamma (−GEX) | Sell when price falls, buy when price rises | Amplifying — extends moves, trending/volatile action |
Trade Structure Models — Volume/OI Flow Detection
Human Reference
New — not in engine
Pattern-based detection of institutional flow from per-strike Volume and OI. Finds bars that stand out (≥3× median vol), then classifies by shape: spread pair (2 bars close together) or single dominant (≥2× next-highest). Adapts to any ticker volume profile.
| Signal | Detection Trigger | 100% (Achieved) | 60–80% (Partial) | 0% (Failed) |
|---|---|---|---|---|
| Bullish Spread Call | 2 OTM call standout bars close together (<10% price gap), both Vol/OI ≥ 3x | >3% upside move within DTE | >1% upside move | No move or wrong direction |
| Bearish Spread Put | 2 OTM put standout bars close together (<10% price gap), both Vol/OI ≥ 3x | >3% downside move within DTE | >1% downside move | No move or wrong direction |
| Bullish Big Call | 1 dominant OTM call bar (≥2× second-highest), Vol/OI ≥ 3x | >3% upside move within DTE | >1% upside move | No move or wrong direction |
| Bullish Sell Put | 1 dominant ITM/ATM put bar (≥2× second-highest), Vol/OI ≥ 2x | Price stays above strike through expiration | Price dips briefly but recovers above strike | Price closes below strike at expiration |
GEX Key Level Definitions
Engine (Black-Scholes)
How each key GEX level is computed and what mechanical role it plays.
| Level | Color | Definition | Mechanical Role |
|---|---|---|---|
| Max Gamma | #FFD54F | Strike with highest |GEX(K)| | Gravitational center; strongest hedging near expiry |
| GEX Flip | #26C6DA | First strike where cumulative GEX crosses zero | Regime boundary: above = pinning, below = trending |
| +GEX #1, #2 | #CE93D8 | Top 2 positive GEX strikes | Resistance ceilings — dealers sell as price rises |
| −GEX #1, #2 | #EF5350 | Most negative GEX strikes | Trapdoors — dealers amplify drops when broken |
ΔOI — Day-over-Day Open Interest Change Detection
Human Reference
New — not in engine
Compares OI at each strike between consecutive days to detect wall crumbling (key-level OI collapse) and wall building (new gamma wall formation). When OI at a key strike disappears, dealers unwind hedges and the stabilizing gamma flow vanishes. The market impact depends on wall type: call wall at resistance, put wall at support, or ATM gamma pin.
| Call Wall Crumble at Resistance | Call OI at strike >2% above price dropped >30% | Resistance weakens — price breaks above former wall or cascades down from hedge unwind | Price drifts from wall | Call OI rebuilds or price ignores |
| Call Wall Crumble at ATM | Call OI at strike within ±2% of price dropped >30% | Gamma pin breaks — dealers unwind long stock hedge → selling pressure → price cascades down (TSLA pattern) | Price becomes volatile near former pin | Price stays pinned |
| Put Wall Crumble at Support | Put OI at strike >2% below price dropped >30% | Support floor disappears — price drops through former wall | Price drifts below former support | Put OI rebuilds or price holds |
| Put Wall Crumble at ATM | Put OI at strike within ±2% of price dropped >30% | Gamma floor breaks — dealers cover short stock hedge → buying pressure eases → volatility expansion | Price becomes volatile | Price stays pinned |
| Call Wall Building at Resistance | Call OI at strike >2% above price grew >30% | Resistance strengthens — price capped, gamma pin forms. Bearish near that strike. | Price slows approaching wall | Price breaks through despite wall |
| Put Wall Building at Support | Put OI at strike >2% below price grew >30% | Support floor solidifies — price floored, bullish. Dealers hedge puts by selling stock on rallies toward strike. | Price stabilizes above wall | Price breaks below despite wall |
| Call Unwinding | Net call OI declining across strikes | Bullish conviction fading, price weakens | Mixed price action | Price rallies despite call unwinding |
| Put Unwinding | Net put OI declining across strikes | Bearish pressure easing, price strengthens | Mixed price action | Price drops despite put unwinding |
Vol-OI Confirmation — Cross-Day Volume → OI Pattern
Human Reference
New — not in engine
Cross-day linkage: match Day 1 volume spikes to Day 2 OI changes at the same strikes. A vol spike followed by OI increase confirms new institutional positioning (wall strengthening). A vol spike followed by OI decrease confirms position unwinding (wall crumbling). Vol spike with flat OI indicates day-trading with no overnight conviction.
| Confirmed Opening | Vol/OI > 1.5× at strike X on Day 1, OI increases ≥5% on Day 2 | Price moves toward confirmed wall within 3 days | Price stabilizes near wall | Price ignores confirmed wall |
| Confirmed Closing | Vol/OI > 1.5× at strike X on Day 1, OI decreases ≥5% on Day 2 | Price moves away from crumbled wall within 3 days | Price moves >1% from wall | Price stays near crumbled wall |
| Day Trade | Vol/OI > 1.5× at strike X on Day 1, OI flat (<5% change) on Day 2 | No overnight conviction — intraday activity only | N/A | N/A |
Multi-Day OI Trend — Persistent Opening/Closing Detection
Human Reference
New — not in engine
Tracks consecutive same-sign OI changes at key strikes over 3+ days across all expirations (aggregate) or per-expiration. Catches both gradual persistent unwinding and sudden collapses. When institutional positions are closed, the aggregate view across all expirations amplifies the signal — a strike losing OI in multiple expirations simultaneously confirms the wall is crumbling structurally, not just in one tenor.
| Persistent Closing | 3+ consecutive days of declining OI at a key strike (total change ≥500 contracts) | Price moves away from crumbled wall as gamma support vanishes | Price starts drifting from the wall | OI decline reverses and wall rebuilds |
| Persistent Opening | 3+ consecutive days of increasing OI at a key strike (total change ≥500 contracts) | Price converges toward new wall as gamma magnetism builds | Price stabilizes near the wall | OI growth stops and wall fails to attract price |
| Accelerating Closing | Persistent closing where each day's ΔOI is larger than the previous | Capitulation — wall collapses rapidly, price cascades | Large move in expected direction | Acceleration stops, wall stabilizes |
| Closing with Volume Confirmation | Persistent closing + Vol/OI > 1.5× on most days | High-confidence closing — institutional unwinding confirmed by daily volume | Price moves as expected | Volume dries up, closing was retail noise |
Position Delta — Dealer Aggregate Exposure
Engine (Black-Scholes)
Where current price sits on the aggregate delta curve (all expirations). Range is anchored by -GEX (support) and +GEX (target). 0 = dealers at max put (short delta) exposure, 1 = dealers at max call (long delta) exposure.
| low | < 0.35 | Dealers put-exposed | Dealers short delta — hedging amplifies downside. Support floor fragile. |
| mid | 0.35–0.65 | Balanced exposure | Neutral delta positioning — neither side dominates hedging flow. |
| high | > 0.65 | Dealers call-exposed | Dealers long delta — hedging dampens upside. Resistance ceiling strong. |
Cross-Asset Regime — SPY×VIX×GLD
Engine (Black-Scholes)
Daily regime from directional changes in SPY, VIX, GLD, TLT. 9 combinations map to distinct market environments. Liquidity-crisis requires ALL assets down (SPY+GLD+TLT down, VIX up).
| risk-on | up | down | down | bullish | 1.0 | Classic risk-on: equities up, hedges down | |
| reflation | up | down | up | bullish | 0.75 | Growth + inflation hedge — broad risk appetite | |
| melt-up | up | up | up | caution | 0.0 | Everything up — fragile, late-cycle warning | |
| nervous-rally | up | up | down | caution | -0.25 | Equities rising but fear rising too — unstable | |
| fear-trade | down | up | up | bearish | -0.75 | Classic risk-off: flight to safety | |
| liquidity-crisis | down | up | down | down | bearish | -1.0 | Everything sold for cash — SPY, GLD, TLT all down, VIX up |
| cash-rotation | down | up | down | up | bearish | -0.5 | Equities sold, rotating to bonds — not full crisis |
| controlled-dip | down | down | up | neutral | 0.25 | Orderly pullback — buyers waiting | |
| complacent | down | down | down | bearish | -0.5 | Silent selling — no panic but no support |
Market Breadth Signals
Engine (Black-Scholes)
Timing signals from breadth velocity, VIX crossings, and divergences. 4-tier priority: threshold crossing > velocity > VIX > divergence.
| thrust | bullish | high | Breadth thrust ≤40→≥60 in 5d — strong broad buying |
| collapse | bearish | high | Breadth collapse ≥60→≤40 in 5d — broad selling |
| vix_buy_strong | bullish | high | VIX crossed below 30 — panic fading |
| vix_buy | bullish | moderate | VIX crossed below 25 with breadth >30% |
| breadth_vix | bullish | moderate | Breadth >70% + VIX >20 — underpriced recovery |
| thrust_early | bullish | moderate | Breadth rising fast — thrust forming |
| collapse_early | bearish | moderate | Breadth falling fast — collapse forming |
| diverge | bearish | low | SPY up but breadth narrow — fragile rally |
| stealth | bullish | low | SPY down but breadth holding — stealth recovery |
Trade Structure Models — Vol/OI Flow Detection
Human Reference
New
Detect institutional / smart money flow from per-strike Volume and Open Interest patterns.
Pattern-based: standout bars (≥3× median vol), spread pairs (2 bars, gap <10% price),
dominant singles (≥2× next-highest). Adapts to any ticker volume profile.
Source: 期权交易结构模型 (winnerstock.club)
| Pattern | Direction | Type / Moneyness | Vol Min | Vol/OI Min | Rec. DTE | Detection Note |
|---|---|---|---|---|---|---|
| BullSprd Bullish Spread Call | Bullish | Call · OTM | 4,000 | 6.0x | 14–120d | Look for 2+ adjacent OTM call strikes with high volume. Confirm OI increase next day. |
| BearSprd Bearish Spread Put | Bearish | Put · OTM | 4,000 | 6.0x | 14–120d | Look for 2+ adjacent OTM put strikes with high volume. Confirm OI increase next day. |
| BigCall Bullish Big Buy Call | Bullish | Call · OTM | 4,000 | 3.0x | 14–120d | Single OTM call strike with high volume. Delta 0.30-0.40 is the institutional sweet spot. |
| SellPut Bullish Big Sell Put | Bullish | Put · ITM_or_ATM | 2,000 | 4.0x | 7–60d | Put strike below current price (ITM put). OI may be zero — new position. |
DTE ranges are recommended trading expirations (not detection restrictions).
Patterns are detected at any DTE. Confirm with next-day OI increase.
GEX × DEX Directional Matrix
Human Reference
Cross-referencing gamma exposure with delta exposure produces a stronger directional signal.
| GEX | DEX | Trend Implication |
|---|---|---|
| Positive (+) | Negative (−) | Bearish 趋势偏空 |
| Negative (−) | Positive (+) | Oscillating / slightly bullish 趋势震荡偏多 |
| Negative (−) | Negative (−) | Bearish 趋势偏空 |
| Positive (+) | Positive (+) | Bullish 趋势偏多 |
GEX Bar Chart Patterns — 9 Scenarios
Human Reference
Field-tested pattern recognition from actual GEX bar charts.
See the Human Reference tab for full chart images, observations, and reasoning.
| # | GEX Distribution | Prediction | Engine Case |
|---|---|---|---|
| 1 | +GEX Above Flip — Concentrated Single Strike | Large strikes act as resistance. Price closes away from peak gamma. | +GEX Above Flip / Pinned at Max Gamma |
| 2 | +GEX Above Flip — Concentrated 2-3 Strikes | Price remains within range where it opened (below or between large strikes). | +GEX Above Flip |
| 3 | +GEX Above Flip — Scattered Negative Below | Price closes above most strikes with negative gamma. Large negative strike and G… | +GEX Above Flip / -GEX Above Flip |
| 4 | +GEX Above Flip — Mixed Wide Spread | Price closes within range between the strikes with significant negative and posi… | Near Flip / +GEX Above Flip |
| 5 | +GEX Below Flip — Wide Scatter, Positive Concentrated | Price closes within range between the strikes with significant negative and posi… | +GEX Below Flip / Near Flip |
| 6 | -GEX Below Flip — Concentrated Single Strike | Price will look to close at the biggest pile. Biggest pile will act as support /… | -GEX Below Flip |
| 7 | -GEX Below Flip — Scattered Multiple Strikes | Price will move and test the biggest piles as support & resistance. Gamma may co… | -GEX Below Flip / No Flip |
| 8 | -GEX Below Flip — Moderate Concentration, Positive Scattered | Price will look to close at or below the biggest negative gamma pile. Negative g… | -GEX Below Flip |
| 9 | -GEX Below Flip — Transitioning to Positive | Price will chase the biggest piles and GEX Flip Point. Often seen when transitio… | +GEX Below Flip / Transitional |
| 10 | -GEX Above Flip — Dominant Negative Pile Above | Large gamma piles act as resistance. Price breaking below dominant piles and GEX… | -GEX Above Flip |
| 11 | -GEX Above Flip — Single Dominant Below, Breakout Higher | Price will be pushed away from large gamma pile. Price breaking above dominant p… | -GEX Above Flip / Breakout |
| 12 | -GEX Above Flip — Multiple Large Piles, Bounded | Large gamma piles act as support & resistance. Most likely to close between larg… | -GEX Above Flip / Near Flip |
| 13 | Gamma Squeeze — Cross-Tenor Convergence | Multi-tenor gamma squeeze setup. A catalyst triggers cascading hedging across AL… | Gamma Squeeze / Cross-Tenor Convergence |
| 14 | Wall Crumble — Key Strike OI Collapse | Gamma pin breaks. Price becomes unanchored and moves away from the crumbled wall… | Wall Crumble / −GEX Cascade |
GEX Distribution Structures — Positive GEX (S1–S5)
Human Reference
Static shape of gamma distribution per-expiration when overall regime is positive GEX or price is above flip.
These structures describe "what does the GEX landscape look like?" and predict end-of-day price behavior.
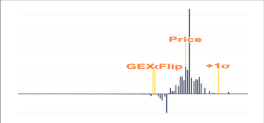
S1 · 结构一
+GEX Above Flip — Concentrated Single Strike
正GEX 高于翻转点 — 集中于单一行权价
Price starts above GEX Flip Point. Net gamma distribution mostly positive. Large positive gamma concentrated at single strike.
Prediction
Large strikes act as resistance. Price closes away from peak gamma.
Engine: +GEX Above Flip / Pinned at Max Gamma
Reasoning
When positive gamma is concentrated at one strike above price, dealer hedging creates a strong resistance ceiling. As price approaches, dealers sell (long gamma = sell high). Price is repelled away from the peak, closing below it. The single dominant strike acts like a magnet that pushes price away rather than pulling it in.
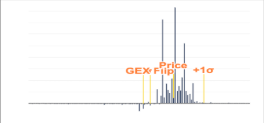
S2 · 结构二
+GEX Above Flip — Concentrated 2-3 Strikes
正GEX 高于翻转点 — 集中于2-3个行权价
Price starts above GEX Flip Point. Net gamma distribution mostly positive. Large positive gamma concentrated at 2 or 3 strikes.
Prediction
Price remains within range where it opened (below or between large strikes).
Engine: +GEX Above Flip
Reasoning
Multiple nearby positive gamma strikes create a broader stabilizing band. Dealers hedge at each level, creating multiple resistance walls. Price oscillates within the zone defined by these strikes rather than being pushed in one direction. The multi-strike ceiling provides a wider 'comfort zone' for price to range.
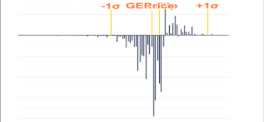
S3 · 结构三
+GEX Above Flip — Scattered Negative Below
正GEX 高于翻转点 — 负Gamma分散在下方
Price starts above GEX Flip Point. Net gamma distribution mostly negative. Negative gamma spread across wide range of strikes below price.
Prediction
Price closes above most strikes with negative gamma. Large negative strike and GEX Flip Point act as support.
Engine: +GEX Above Flip / -GEX Above Flip
Reasoning
Despite mostly negative gamma overall, price is above the flip — in the 'safe zone.' The scattered negative piles below act as a support floor: if price drops toward them, dealers must sell aggressively (short gamma), exhausting selling pressure quickly. The flip point becomes a key support level. Price stays above the negative cluster.
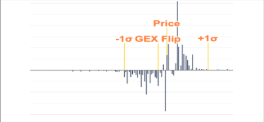
S4 · 结构四
+GEX Above Flip — Mixed Wide Spread
正GEX 高于翻转点 — 混合宽分布
Price starts above GEX Flip Point. Net gamma distribution mixed. Gamma spread across wide range of strikes.
Prediction
Price closes within range between the strikes with significant negative and positive gamma.
Engine: Near Flip / +GEX Above Flip
Reasoning
Mixed gamma spread widely means no single cluster dominates. Both positive and negative piles exist across the strike range. Price is bounded by the positive ceiling above and negative floor below. The flip point provides an anchor, and price oscillates within the wide band defined by the largest piles on each side.
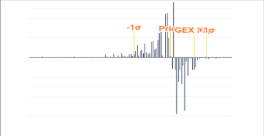
S5 · 结构五
+GEX Below Flip — Wide Scatter, Positive Concentrated
正GEX 低于翻转点 — 宽分布,正Gamma集中
Price starts below GEX Flip Point. Gamma spread across wide range of strikes. 50% to 90% negative gamma, scattered across strikes. Positive gamma is concentrated in 1 or 2 strikes.
Prediction
Price closes within range between the strikes with significant negative and positive gamma.
Engine: +GEX Below Flip / Near Flip
Reasoning
Price is below the flip in a mixed environment. The concentrated positive strikes above act as an attractor (dealers buy on dips near them), while scattered negative gamma below amplifies moves away from support. The wide scatter prevents any single level from dominating. Price settles between the key positive and negative clusters.
GEX Distribution Structures — Negative GEX (S6–S12)
Human Reference
Static shape of gamma distribution when overall regime is negative GEX or price is below flip.
Negative structures are more dangerous — amplifying regimes where price accelerates through levels.
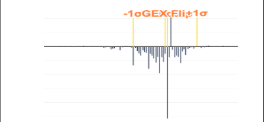
S6 · 结构六
-GEX Below Flip — Concentrated Single Strike
负GEX 低于翻转点 — 集中于单一行权价
Price starts below GEX Flip Point. 90% to 100% of gamma is negative AND concentrated at one strike.
Prediction
Price will look to close at the biggest pile. Biggest pile will act as support / resistance.
Engine: -GEX Below Flip
Reasoning
When nearly all gamma is concentrated at one negative strike, that strike becomes the dominant gravitational center. Dealers are massively short gamma there — any price movement toward it triggers amplified hedging. If price is above, the strike acts as support (dealers sell aggressively on approach, exhausting supply). If below, it acts as resistance. Price is magnetically drawn to close near this dominant pile.
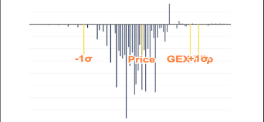
S7 · 结构七
-GEX Below Flip — Scattered Multiple Strikes
负GEX 低于翻转点 — 分散于多个行权价
Price starts below GEX Flip Point. 90% to 100% of gamma is negative. Gamma is scattered across multiple strikes.
Prediction
Price will move and test the biggest piles as support & resistance. Gamma may concentrate in one, two or three strikes as the day progresses. Price accelerates away from largest piles.
Engine: -GEX Below Flip / No Flip
Reasoning
Scattered negative gamma creates a minefield — each pile is a potential acceleration point. As the day progresses, gamma concentrates (expiring contracts converge) and the scattered piles coalesce into fewer dominant levels. Price tests each pile; once broken, the next pile becomes the target. This creates the 'trapdoor cascade' effect where breaking one level accelerates to the next.
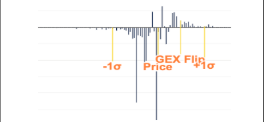
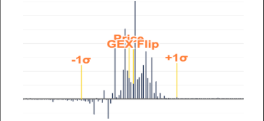
S8 · 结构八
-GEX Below Flip — Moderate Concentration, Positive Scattered
负GEX 低于翻转点 — 适度集中,正Gamma分散
Price starts below GEX Flip Point. 50% to 90% negative gamma, concentrated in 1 or 2 strikes. Positive gamma is scattered across several strikes.
Prediction
Price will look to close at or below the biggest negative gamma pile. Negative gamma piles will act as support and resistance.
Engine: -GEX Below Flip
Reasoning
The concentrated negative piles dominate price action — they are the key levels. Scattered positive gamma above provides weak resistance but not enough to trap price. The dominant negative piles create a gravitational pull: price closes near or below them because dealer hedging is concentrated at these levels. This is the classic 'trapdoor with weak ceiling' structure.
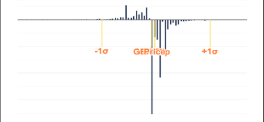
S9 · 结构九
-GEX Below Flip — Transitioning to Positive
负GEX 低于翻转点 — 向正GEX过渡
Price starts below GEX Flip Point. 90% to 100% of gamma is positive. Gamma is scattered across multiple strikes.
Prediction
Price will chase the biggest piles and GEX Flip Point. Often seen when transitioning out of negative GEX regime.
Engine: +GEX Below Flip / Transitional
Reasoning
This is the recovery structure: gamma has shifted positive (call buying or put selling dominated) but price hasn't caught up yet — it's still below the flip. The scattered positive gamma above acts as a series of magnets pulling price upward. As price approaches each positive pile, dealers buy (long gamma = buy dips), accelerating the move toward the flip. This is the 'bullish escape' from a negative GEX environment.
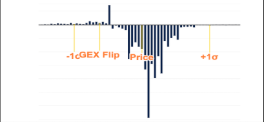
S10 · 结构十
-GEX Above Flip — Dominant Negative Pile Above
负GEX 高于翻转点 — 上方主导负Gamma堆积
Price starts above GEX Flip Point. More than 80% gamma is negative. 1 or 2 dominant negative gamma pile above price.
Prediction
Large gamma piles act as resistance. Price breaking below dominant piles and GEX Flip accelerates lower.
Engine: -GEX Above Flip
Reasoning
Dominant negative piles ABOVE price create intense downward pressure. Dealers are short gamma at those levels — any rally toward the pile triggers aggressive selling. The negative pile above acts as a ceiling that is almost impossible to break through. If price breaks below the flip, the entire negative structure accelerates the move lower. This is the 'bear trap above' — price is stuck below the dominant negative mass.
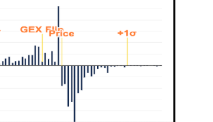
S11 · 结构十一
-GEX Above Flip — Single Dominant Below, Breakout Higher
负GEX 高于翻转点 — 下方单一负Gamma堆积,向上突破
Price starts above GEX Flip Point. More than 80% gamma is negative. 1 dominant negative gamma pile (below price).
Prediction
Price will be pushed away from large gamma pile. Price breaking above dominant piles accelerates higher.
Engine: -GEX Above Flip / Breakout
Reasoning
When the dominant negative pile is BELOW price but above flip, dealers' short gamma position at that level creates a 'repelling force.' Price is pushed away from the pile — if above it, dealer hedging accelerates the upward move. Breaking above creates a gamma-assisted breakout: there's nothing above to stop the move, and the negative pile below now acts as a floor preventing return. This is the 'launch pad' structure.
S12 · 结构十二
-GEX Above Flip — Multiple Large Piles, Bounded
负GEX 高于翻转点 — 多个大型堆积,受限区间
Price starts above GEX Flip Point. More than 50% of gamma is negative. 2+ large negative gamma piles.
Prediction
Large gamma piles act as support & resistance. Most likely to close between largest negative and positive gamma piles.
Engine: -GEX Above Flip / Near Flip
Reasoning
Multiple large negative piles create a 'corridor' — each one acts as a wall. Price bounces between the piles because breaking any one of them triggers amplified moves toward the next. The piles both above and below price create containment. Price settles in the zone between the largest opposing forces. This is the 'bounded chaos' structure — high intraday volatility within a defined range.
Cross-Tenor Patterns — Gamma Squeeze (S13)
New
Multi-expiration convergence analysis. Orthogonal to per-exp structures — a ticker can be in
Structure S4 and show gamma squeeze across expirations simultaneously.
S13 · Gamma Squeeze — Cross-Tenor Convergence ★
Gamma Squeeze — Cross-Tenor Convergence
多到期日Gamma挤压 — 跨期限汇聚
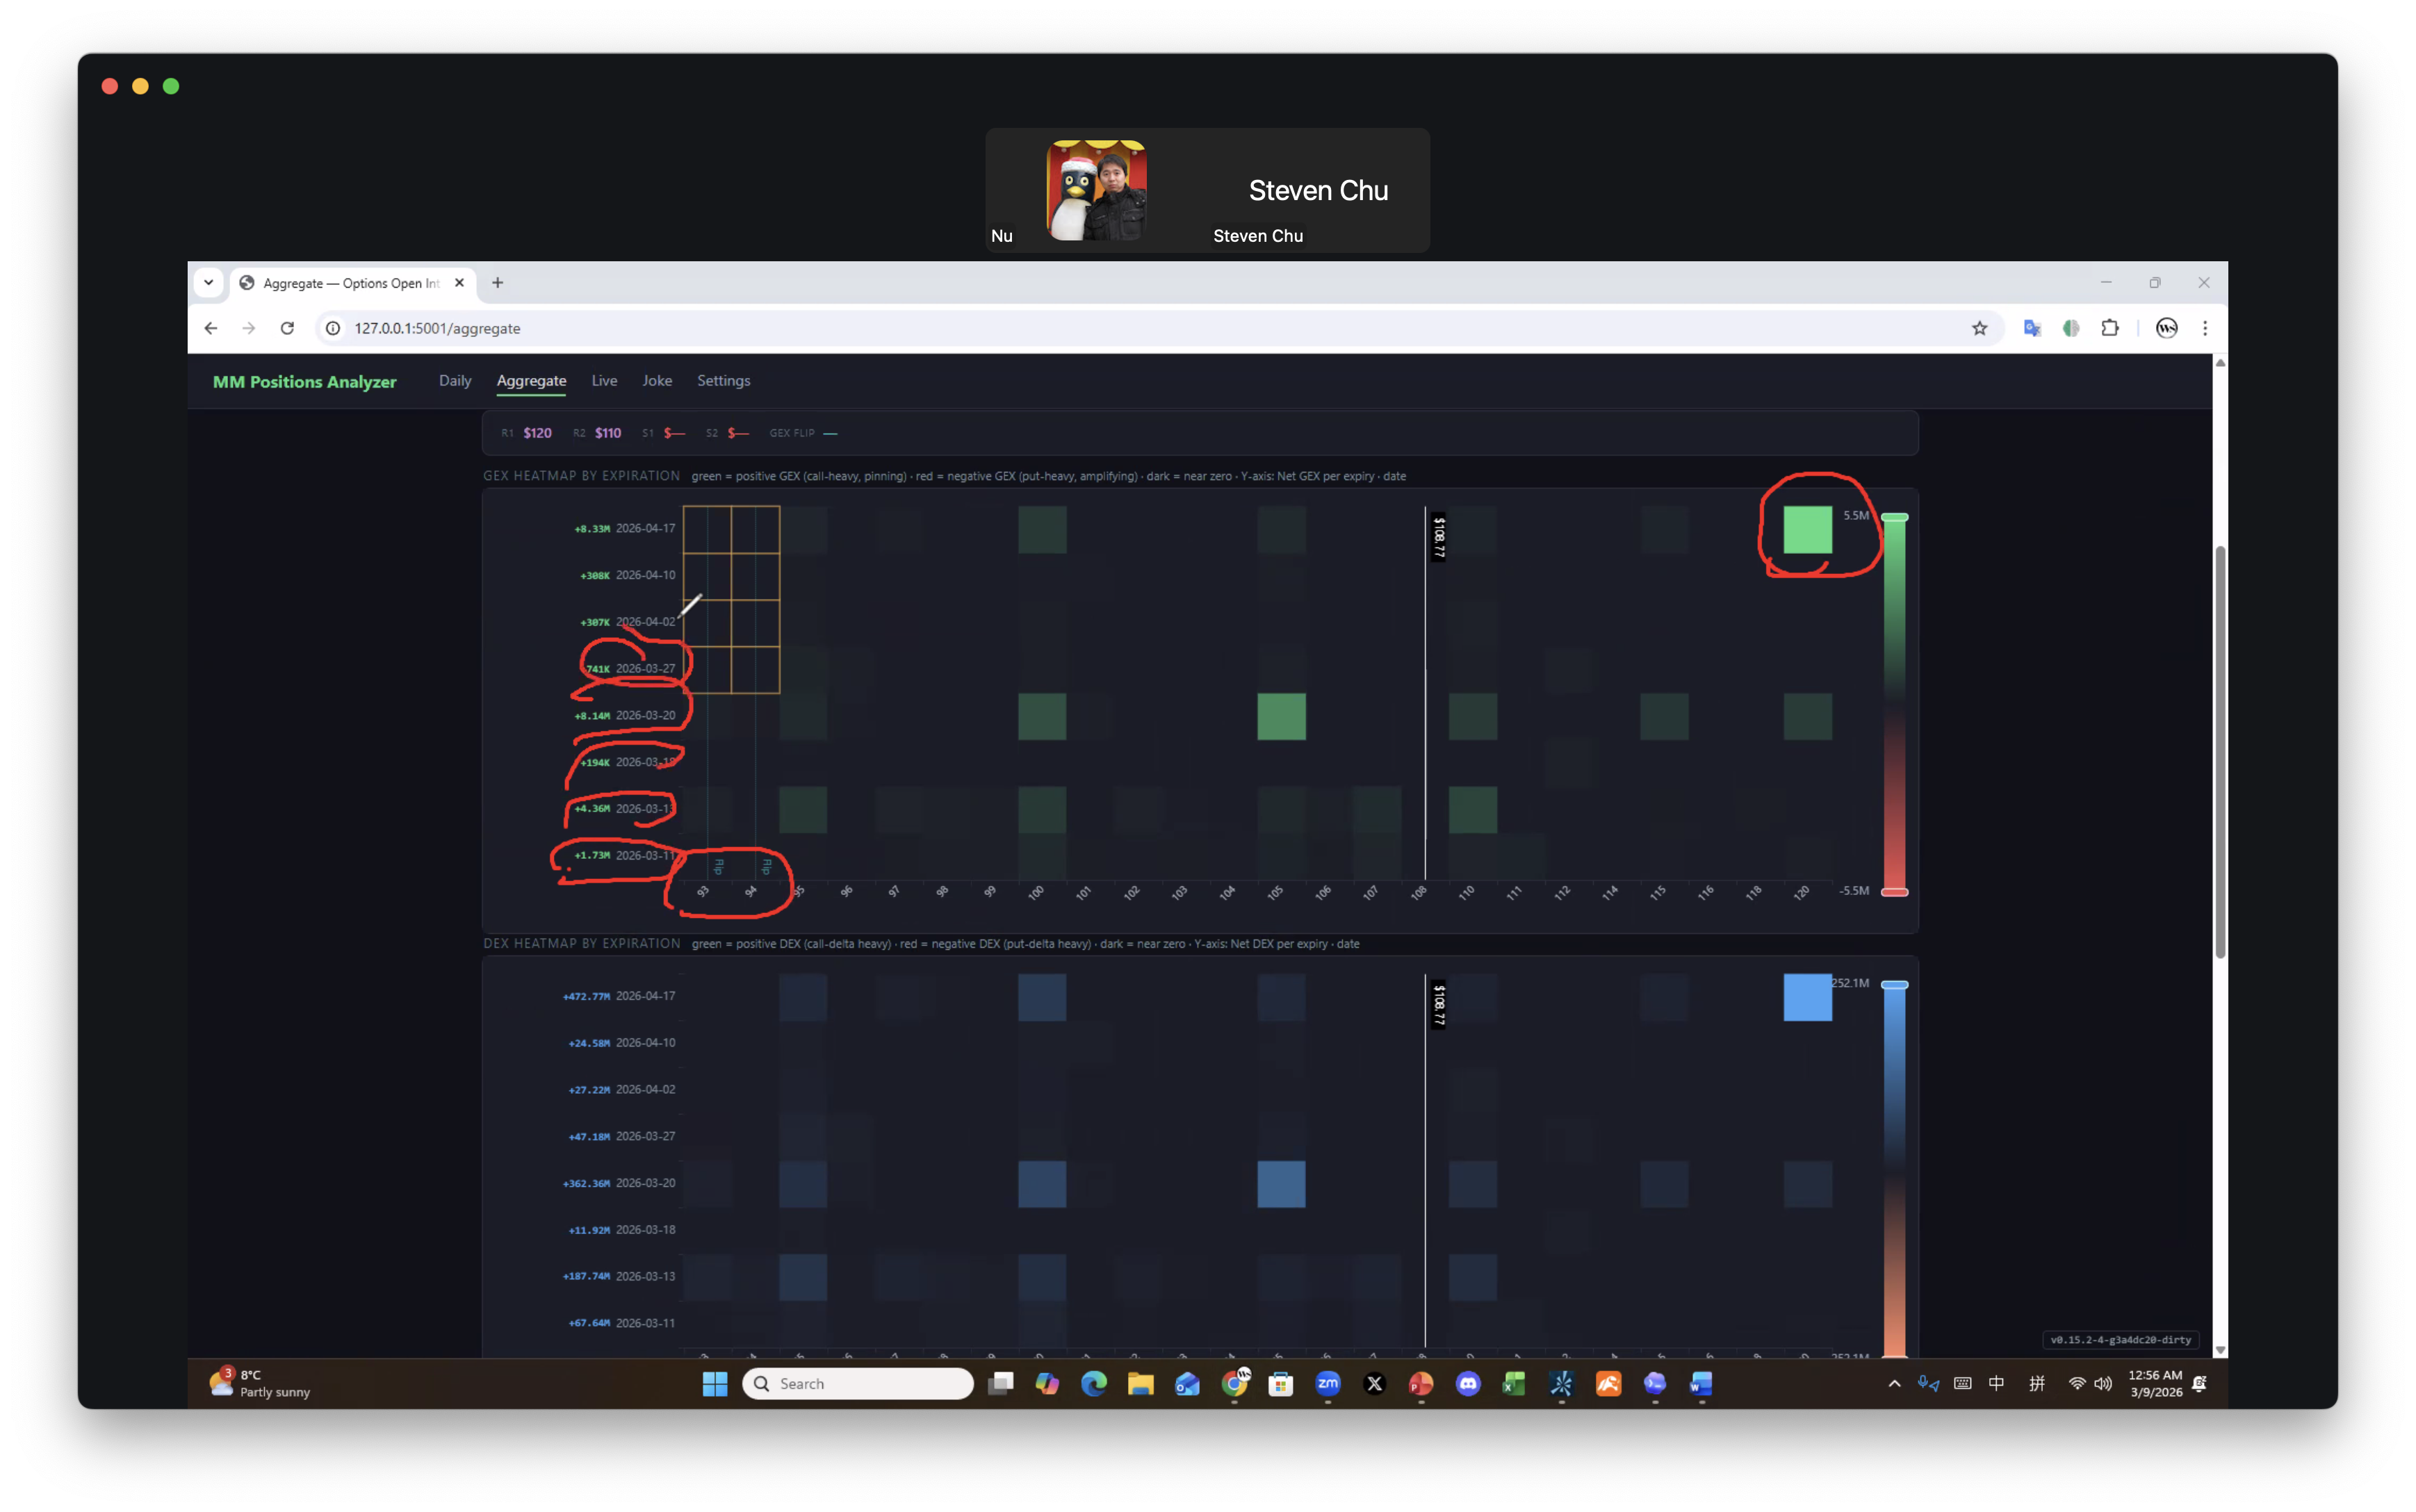
2+ expirations (e.g. 3/10, 3/14, 3/21, 4/17) ALL show DEX/GEX/VEX peaks at the same strike zone (e.g. $100). Aggregate heatmap shows consistent positive GEX/DEX across all tenors. Far-dated expiration shows large call OI at nearby higher strike, confirming directional conviction.
Prediction
Multi-tenor gamma squeeze setup. A catalyst triggers cascading hedging across ALL expirations simultaneously — each expiration's dealer hedging stacks at the same strike zone. Expect explosive move in the consensus direction.
★ Engine: Gamma Squeeze / Cross-Tenor Convergence
Reasoning
Each expiration independently creates delta/gamma/vanna hedging demand at the convergence strike. Dealers must hedge EACH expiration separately, so hedging flows compound. When a catalyst hits: (1) near-term exp has highest gamma → immediate hedging cascade; (2) mid-term exp contributes sustained hedging pressure; (3) far-term exp shows institutional conviction and adds vanna-driven hedging on IV changes. The aggregate effect is multiplicative, not additive. Case study: USO 2026-03-07 — 5+ expirations all peaked at $100, geopolitical catalyst drove $80→$120+ move.
Gamma Squeeze Case Study — USO $100 Strike (2026-03-07)
New
When DEX, GEX, and VEX all peak at the same strike across multiple expirations,
that strike becomes a massive hedging magnet. Dealer hedging compounds across the entire
expiration chain. The USO case demonstrated this with 5+ expirations converging at $100.
Human Reference
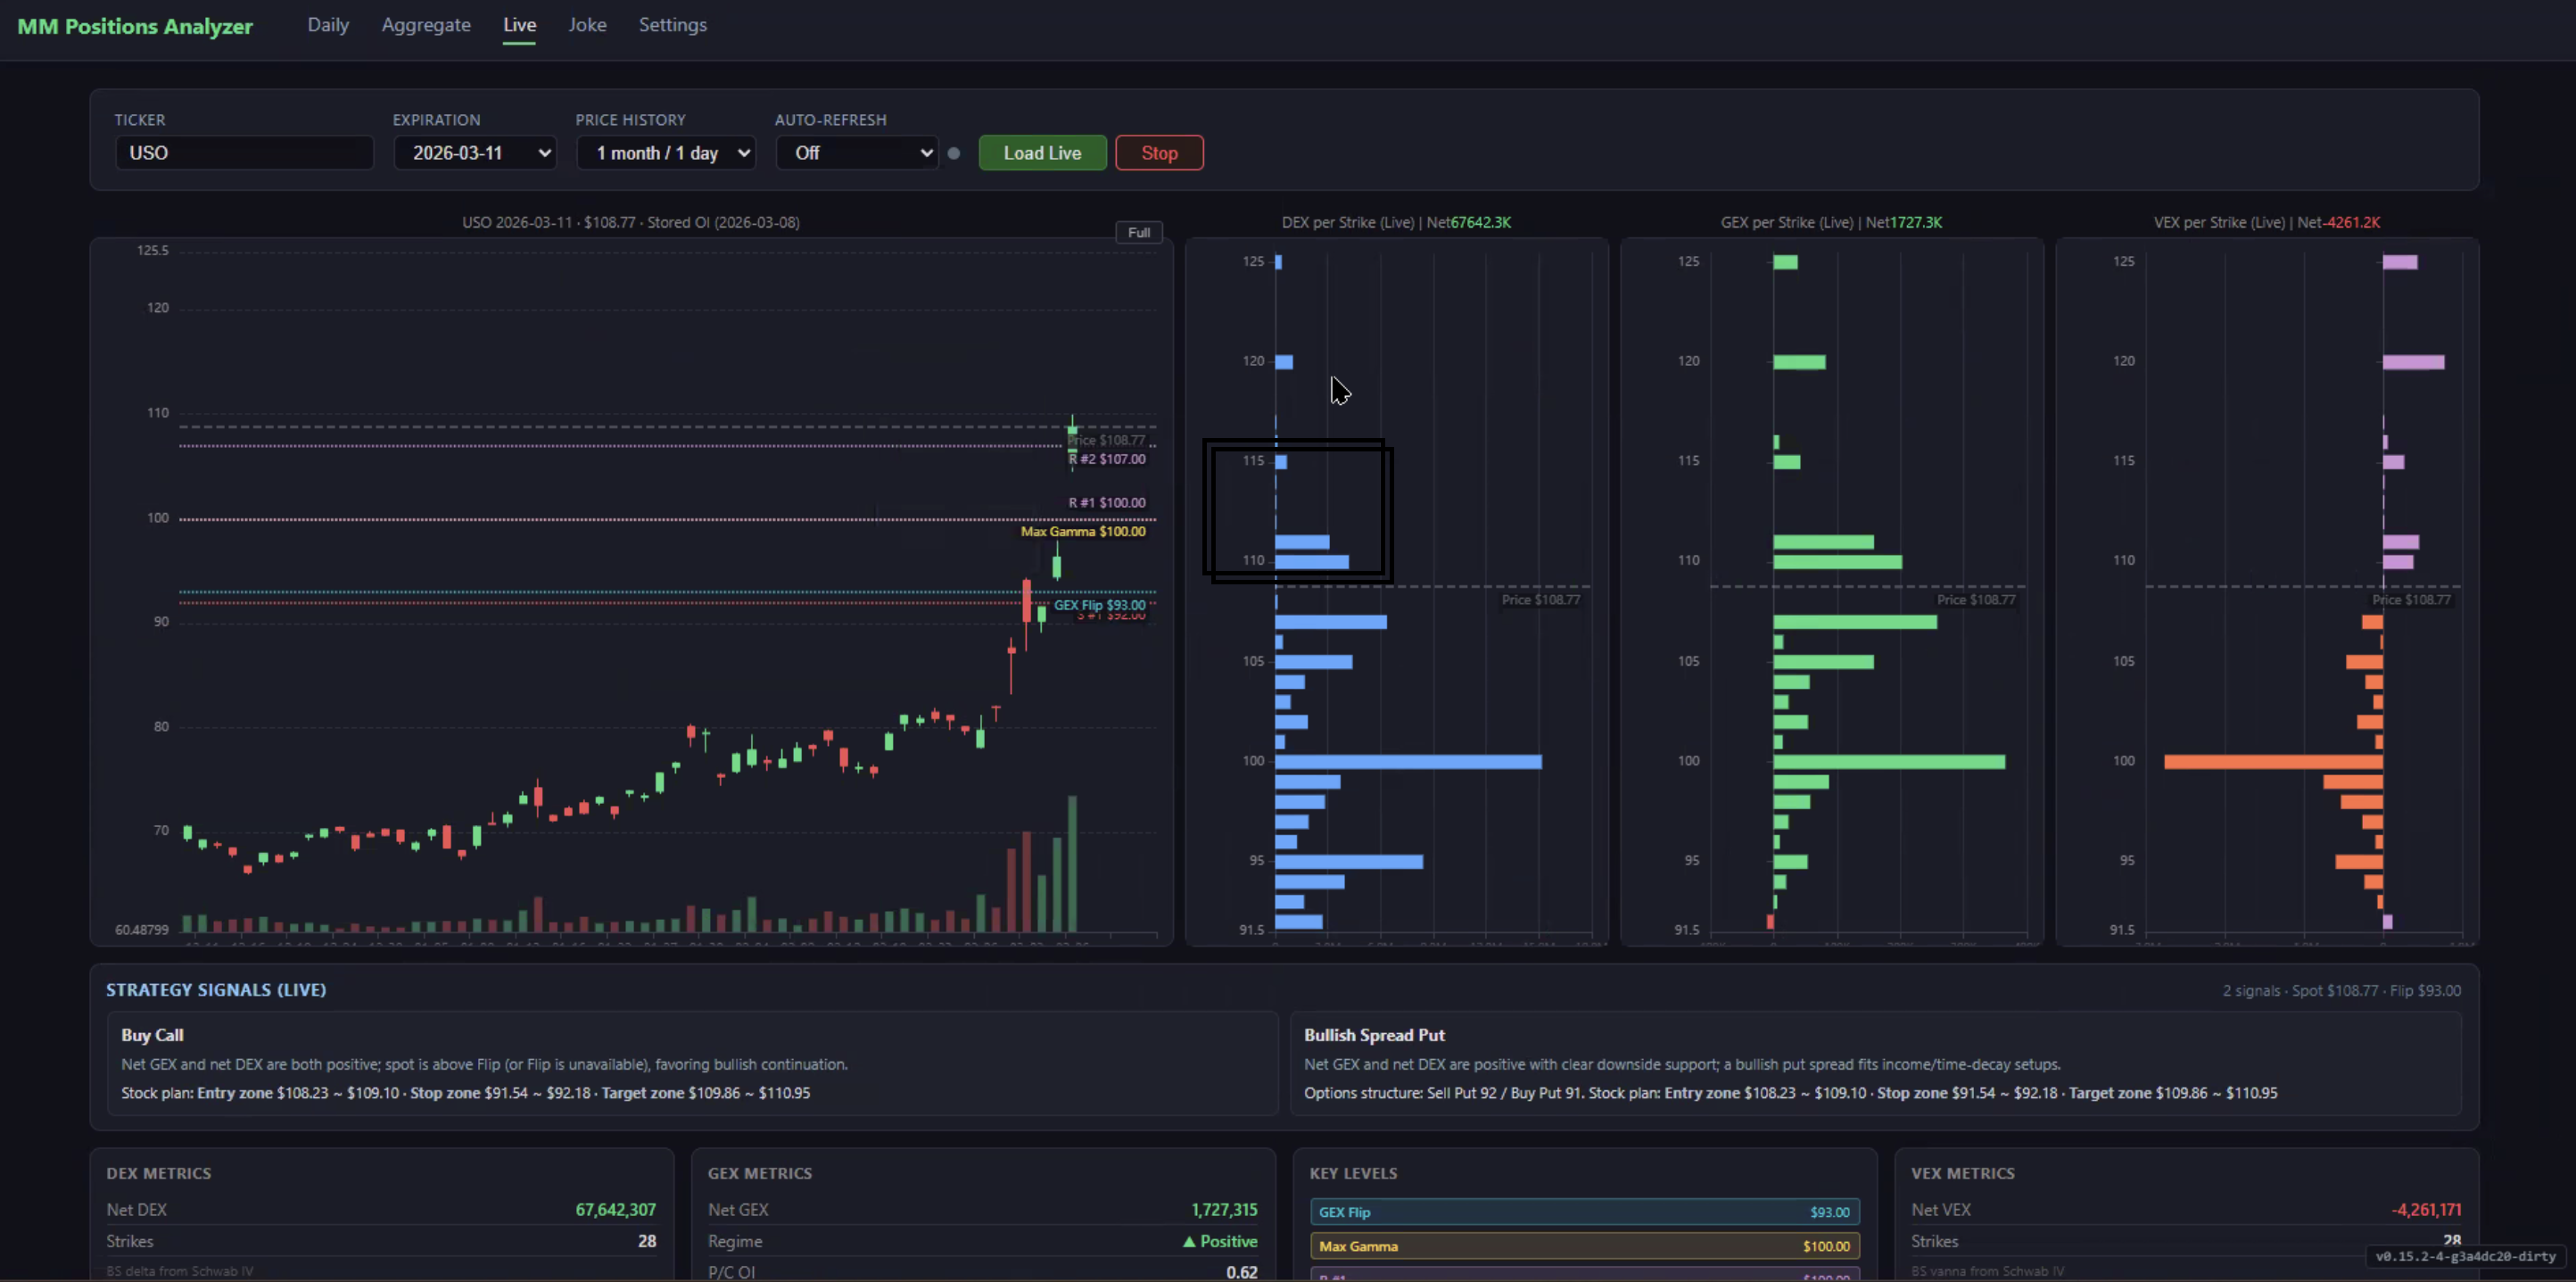
Step 1 · Single-Exp Convergence ★
DEX/GEX/VEX All Peak at $100
Daily page: DEX, GEX, and VEX per-strike charts all show peak at $100 for the 3/10 expiration.
The strike is simultaneously the largest positioning, gamma-hedging, and IV-sensitivity zone.
Prediction
When all three exposure types converge at one strike, that strike becomes a hedging magnet.
Dealer activity concentrates there, creating strong gravitational pull on price.
★ Engine: γSqz Single-Exp
Reasoning
DEX peak = largest directional positioning. GEX peak = most gamma hedging. VEX peak = highest
IV sensitivity. All three at $100 means dealers must hedge there regardless of which Greek
drives the move — the strike is structurally dominant.
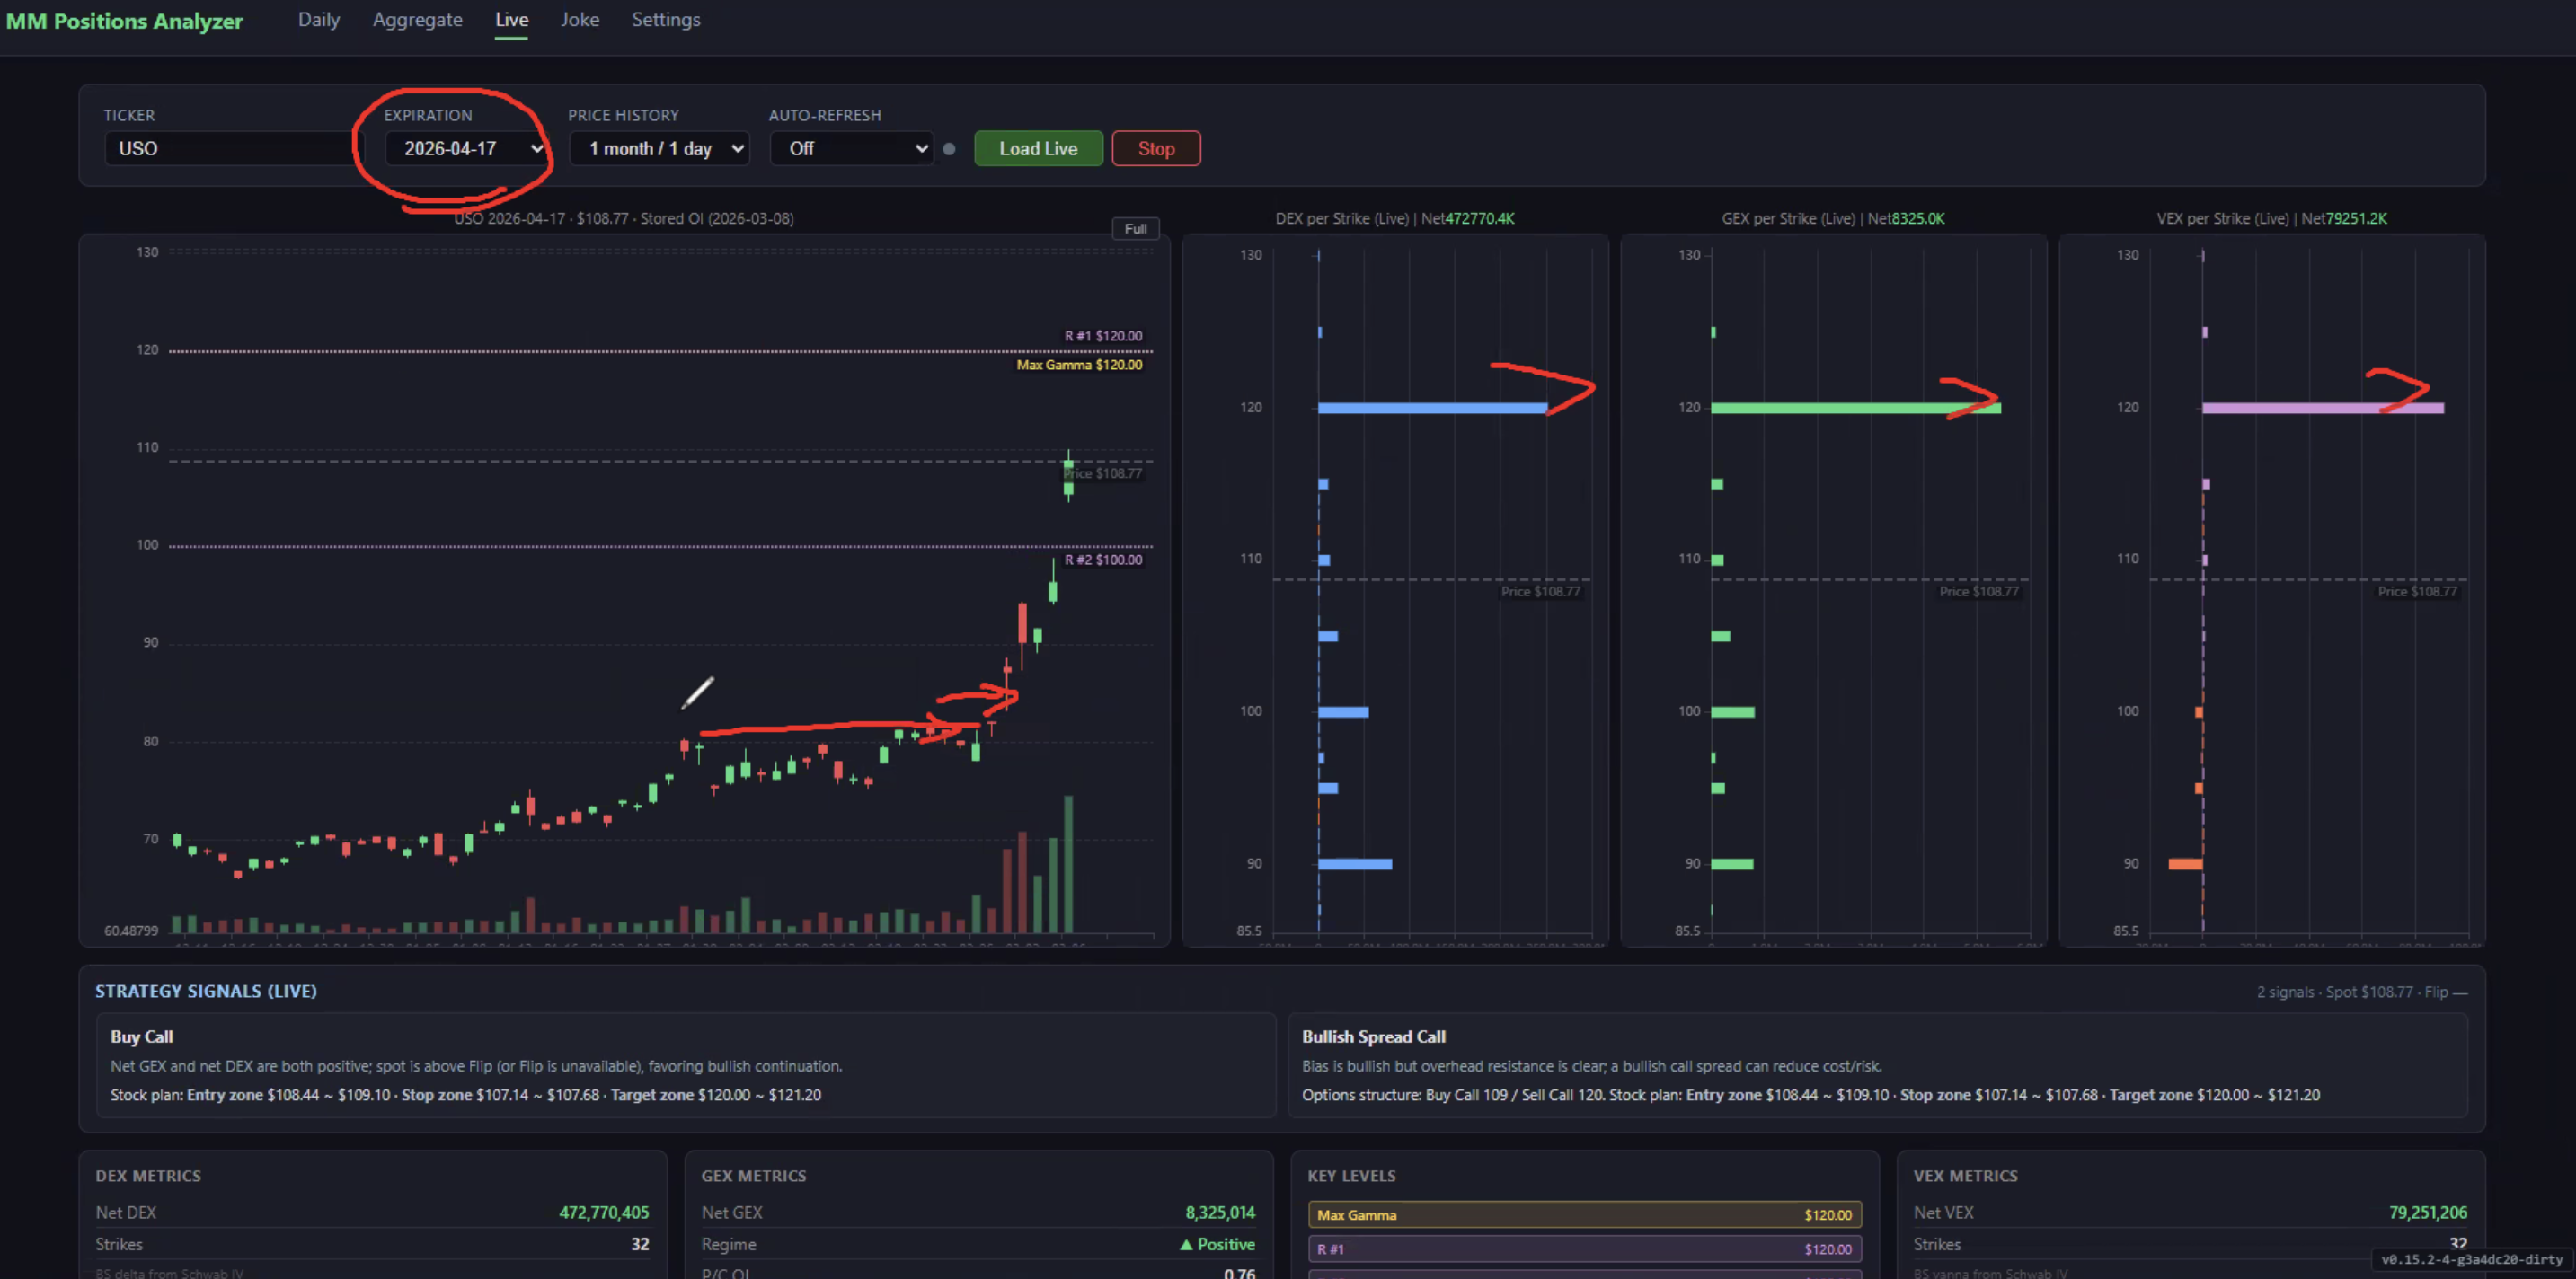
Step 2 · Multi-Exp Confirm ★
Multiple Expirations Confirm at $100
Switching to the 4/17 expiration shows DEX/GEX/VEX peaks also at $100.
When multiple expirations all converge at the same strike, dealer hedging pressure stacks.
Prediction
Multi-expiration convergence = compounding dealer hedging. Each tenor forces independent
buying/selling at $100, multiplying the squeeze force.
★ Engine: γSqz Multi-Exp
Reasoning
3/10, 3/14, 3/21, and 4/17 all converge at $100. Each expiration has its own gamma exposure
that must be hedged independently. When price moves toward $100, ALL expirations trigger
hedging simultaneously — the aggregate force is 4× a single-exp signal.
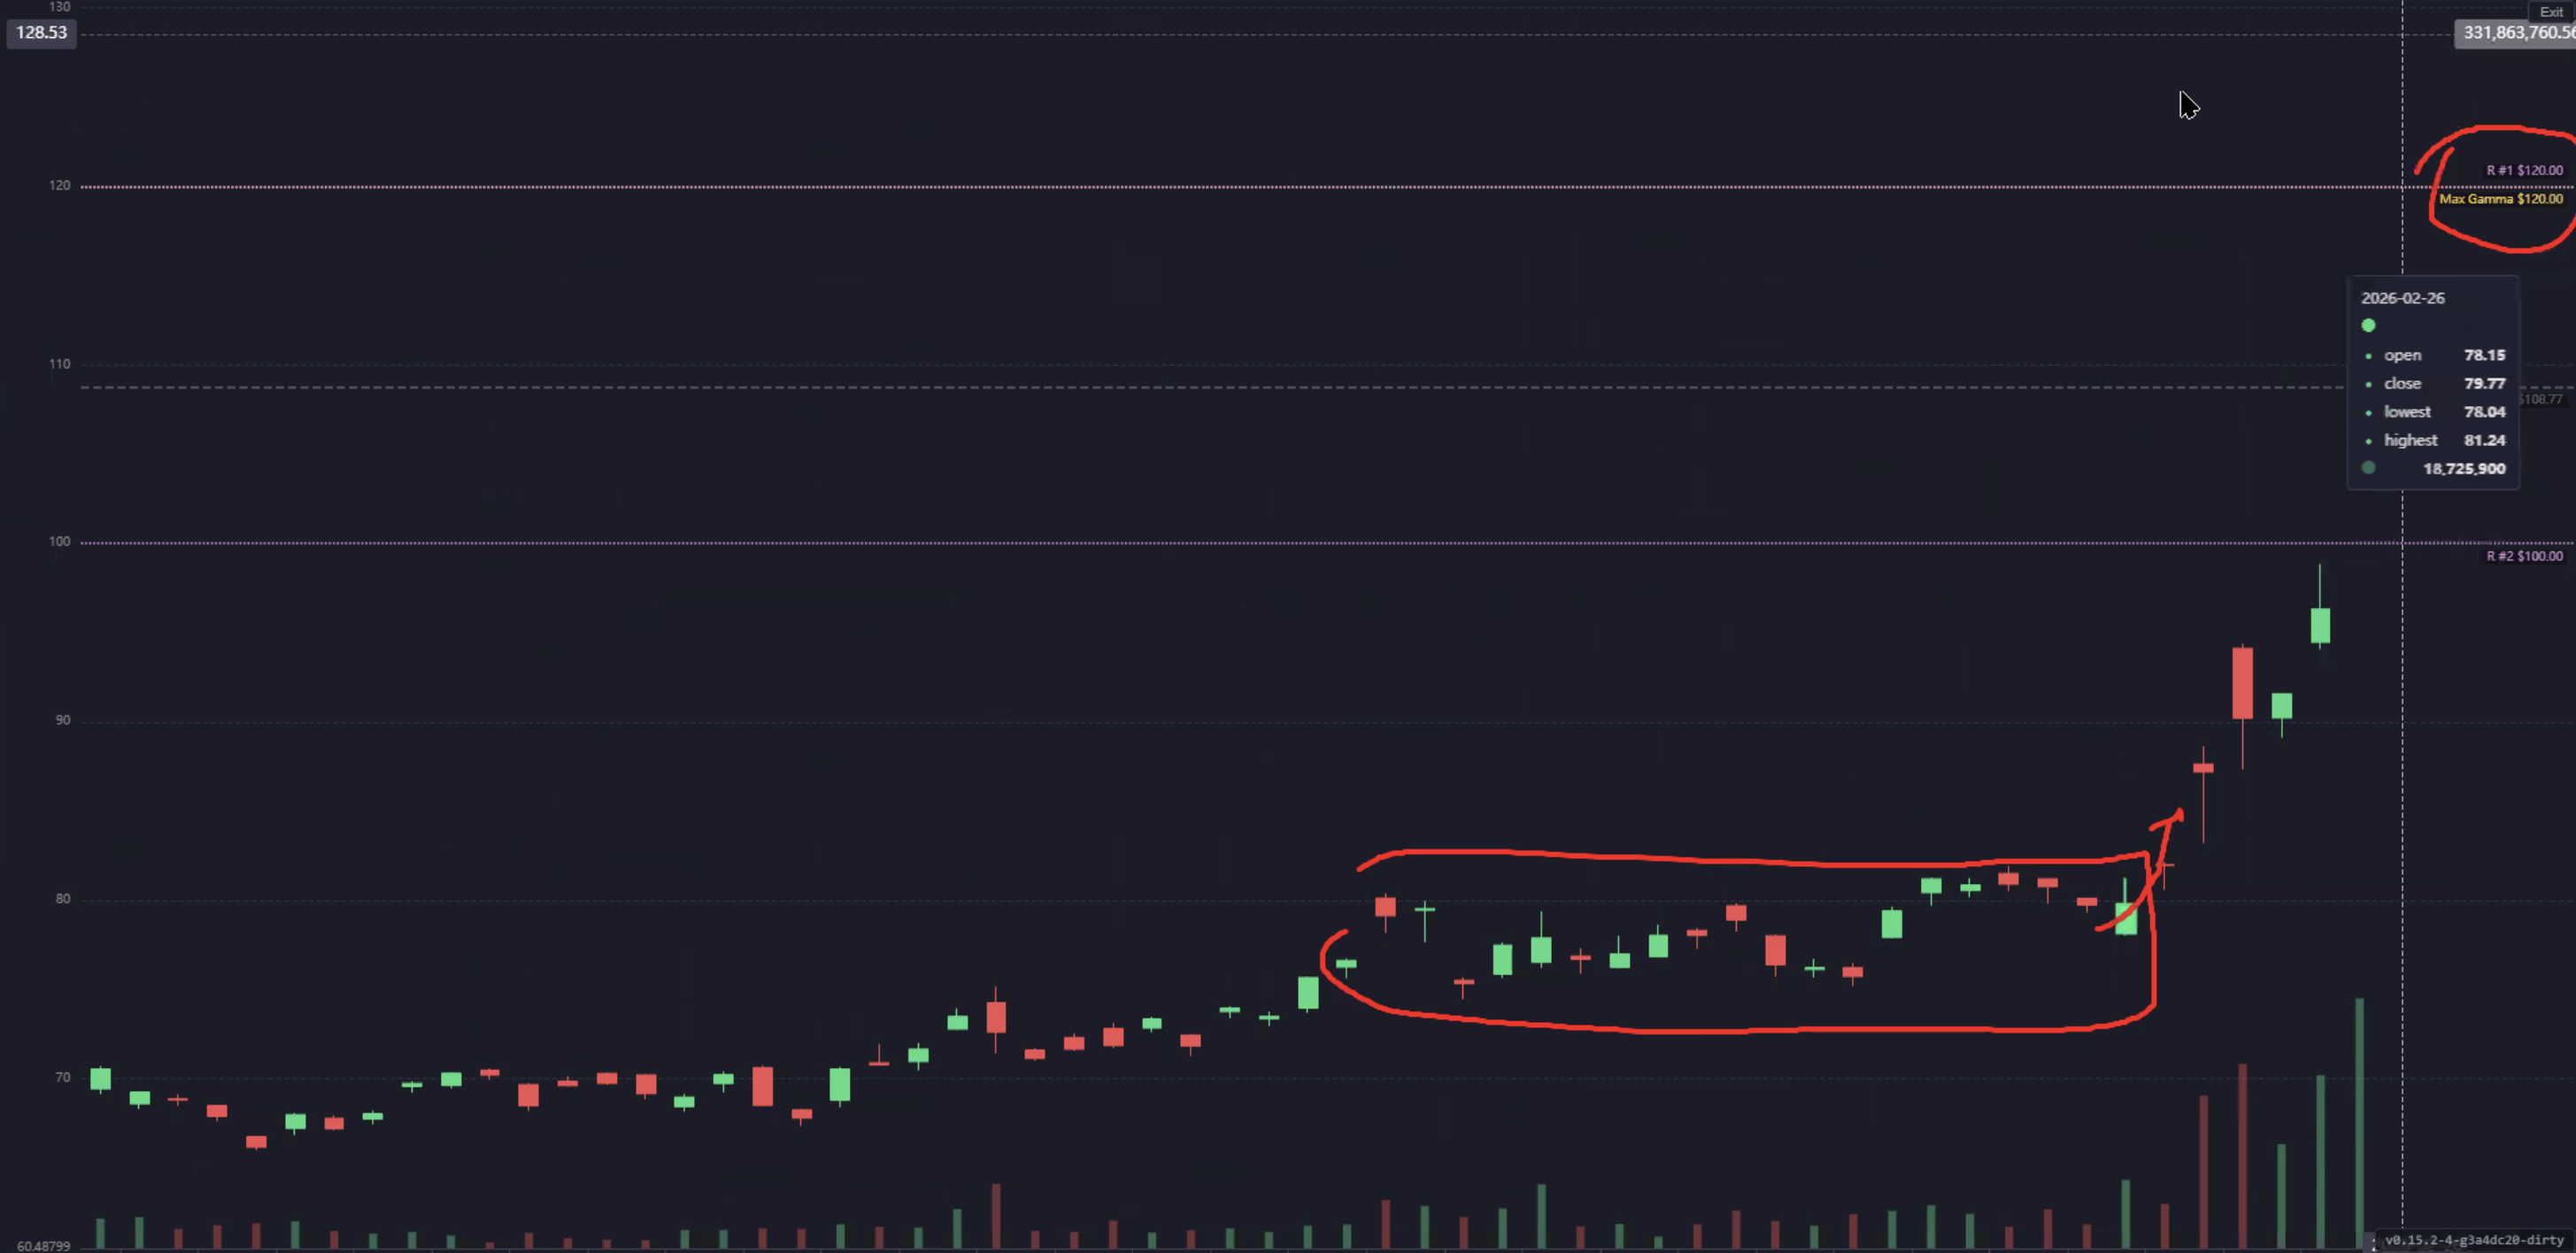
Result · Gamma Squeeze ★
Price Squeeze: $80 → $120+ (+50%)
After geopolitical catalyst, USO squeezed from ~$80 to $120+. Multi-expiration convergence
meant dealer hedging cascaded across ALL tenors simultaneously.
Prediction
Multi-exp gamma convergence + strong catalyst = explosive squeeze.
★ Engine: γSqz Cascade
Reasoning
5+ expirations all had convergence at $100 with positive GEX. When the catalyst hit, dealer
hedging from ALL expirations triggered buying simultaneously — aggregate buying pressure was
4-5× what any single expiration would create.
OI Dynamics — Wall Crumble (S14)
New
Temporal change in open interest at key strikes. Orthogonal to static structures — a Wall Crumble
can happen within ANY of the 12 GEX distribution structures above.
S14 · Wall Crumble — Key Strike OI Collapse ★
Wall Crumble — Key Strike OI Collapse
壁崩 — 关键行权价OI崩溃
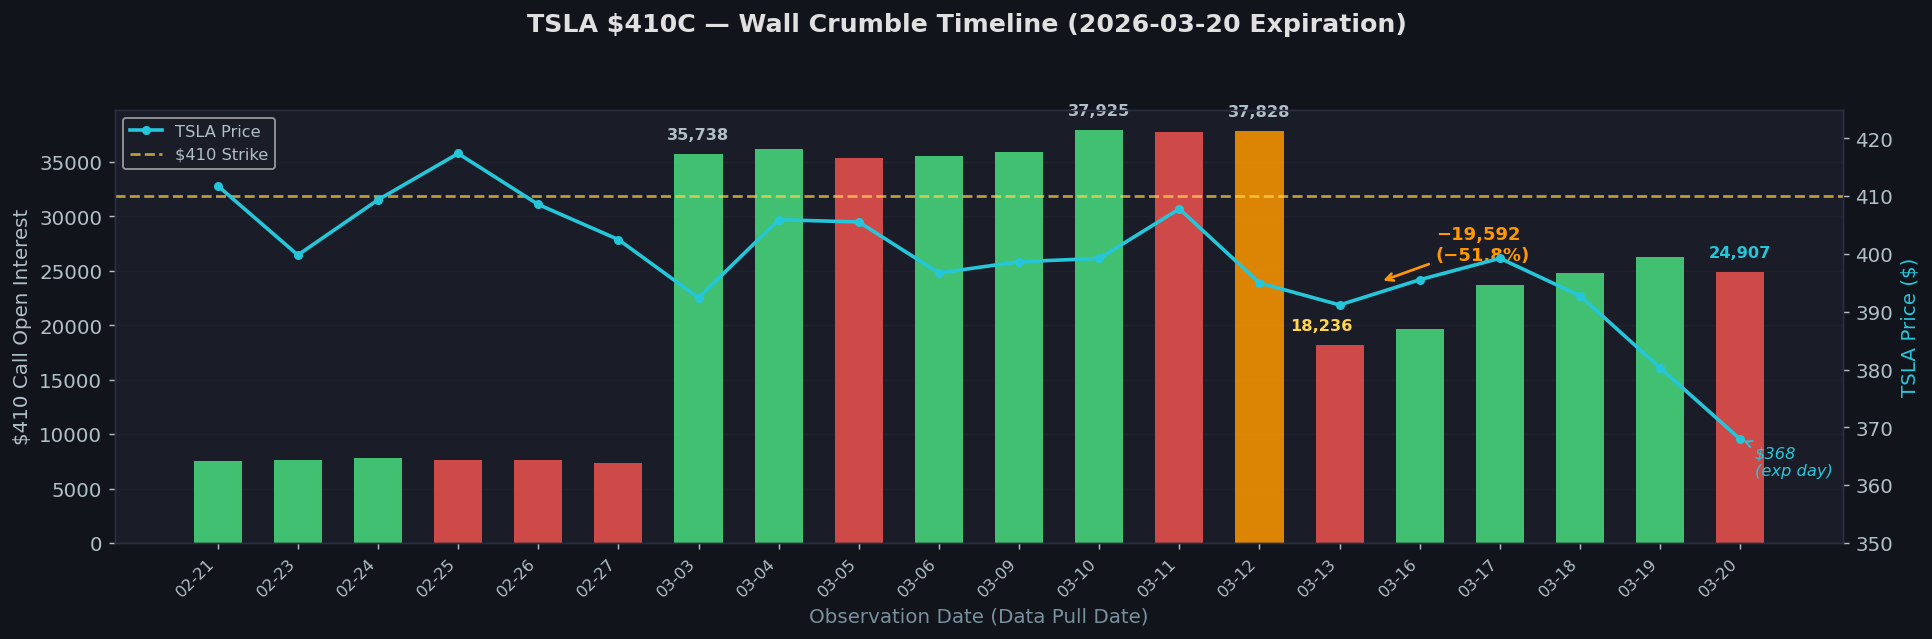
A dominant strike accumulates massive OI (35K+ contracts), creating a gamma wall that pins price. Then OI drops 50%+ in a single day while price is still near the strike.
Prediction
Gamma pin breaks. Price becomes unanchored and moves away from the crumbled wall, often violently in the direction of net GEX.
★ Engine: Wall Crumble / −GEX Cascade
Reasoning
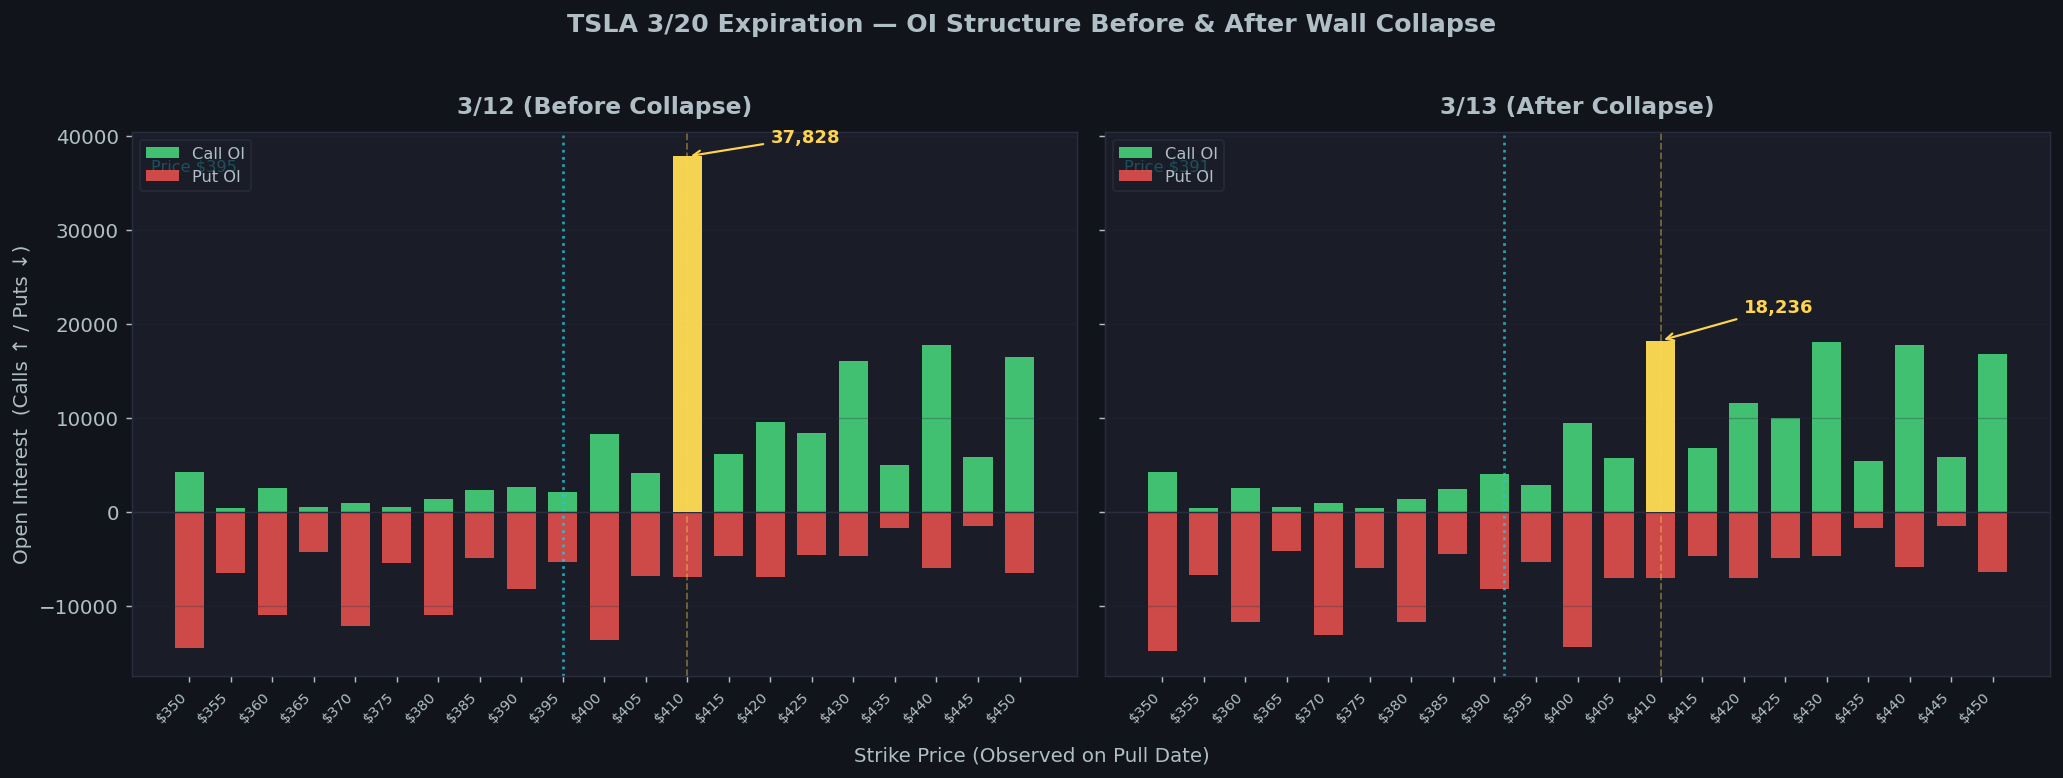
When OI at a key strike disappears, dealers unwind hedges. The stabilizing gamma flow vanishes, and price cascades in the direction of net GEX. TSLA 3/13: $410C OI halved (−19,592 contracts, from 37,828 to 18,236). Net GEX flipped to −17.8M. Price fell from $407 to $368 over 5 trading days, a 9.6% decline.
Wall Crumble Case Study — TSLA $410C (2026-03-08→20)
Before vs After ★
$410C OI: 37,828 → 18,236 (−51.8%)
OI built from 7,500 to 37,828 creating the dominant gamma wall. On 3/13: collapsed to 18,236.
Vol spike to 37,363 on 3/12 (Vol/OI ~1.0×) was the early warning.
Prediction
Vol spike at key strike + next-day OI collapse = confirmed closing. Price cascades away
from crumbled wall. TSLA fell from $408 → $368 (−9.6%) in 7 trading days.
★ Engine: Vol→OI Confirmed Closing
Reasoning
37,828 OI at $410C = dealers long ~38K gamma. When half vanishes overnight, ~19K contracts
of hedging demand disappears. Net GEX flipped negative → amplifying regime → price cascades.
| Date | $410C OI | ΔOI | Volume | Signal |
|---|---|---|---|---|
| 3/03 | 35,738 | — | 3,699 | Wall established (~36K) |
| 3/10 | 37,925 | +2,036 | 6,597 | Wall peak |
| 3/12 | 37,828 | +32 | 37,363 | ⚠ Vol spike (Vol/OI ~1.0×) |
| 3/13 | 18,236 | −19,592 | 12,076 | Wall crumbled (−51.8%) |
| 3/20 | 24,907 | — | 4,227 | Expiration: TSLA at $368 (−9.6%) |
GEX × DEX Directional Matrix
Cross-referencing GEX (gamma exposure) with DEX (delta exposure) gives a stronger directional signal.
Human Reference
| GEX | DEX | Trend Implication | Chinese |
|---|---|---|---|
| Positive (+) | Negative (−) | Bearish | 趋势偏空 |
| Negative (−) | Positive (+) | Oscillating / slightly bullish | 趋势震荡偏多 |
| Negative (−) | Negative (−) | Bearish | 趋势偏空 |
| Positive (+) | Positive (+) | Bullish | 趋势偏多 |
Trade Structure Models — Vol/OI Flow Detection
Detect institutional / smart money flow from per-strike Volume and Open Interest patterns.
Based on 期权交易结构模型 (winnerstock.club / 美股赢家).
Human Reference
Model 1 · 模型一 ★
BullSprd
Bullish Spread Call
看涨价差 Call Spread
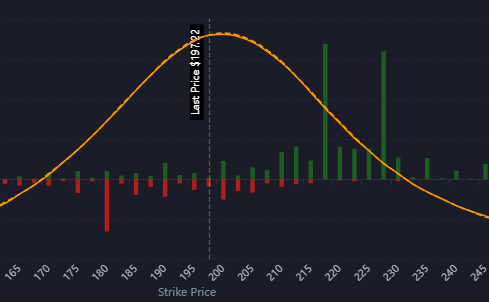
Buy a lower-strike Call + sell a higher-strike Call. Same underlying, same expiration, different strikes. Detected by unusual OTM call volume with high Vol/OI ratio.
Detection Pattern
Call ·
OTM ·
Vol/OI ≥ 6.0x
★ Direction: Bullish
Reasoning
Large volume on OTM calls with very high Vol/OI ratio suggests institutional spread entry. The spread structure (buy lower, sell higher) caps max gain but reduces cost — a hallmark of confident directional bets by smart money.
Model 2 · 模型二 ★
BearSprd
Bearish Spread Put
看跌价差 Put Spread
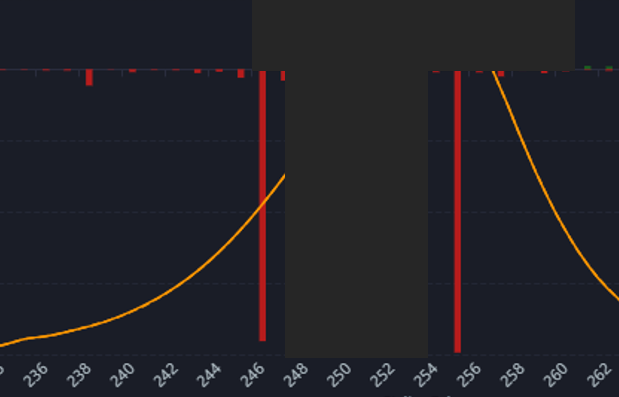
Buy a higher-strike Put + sell a lower-strike Put. Same underlying, same expiration, different strikes. Detected by unusual OTM put volume with high Vol/OI ratio.
Detection Pattern
Put ·
OTM ·
Vol/OI ≥ 6.0x
★ Direction: Bearish
Reasoning
Large volume on OTM puts with very high Vol/OI ratio suggests institutional bear spread. The spread structure limits risk while expressing a directional bearish view — often used ahead of expected pullbacks or earnings risk.
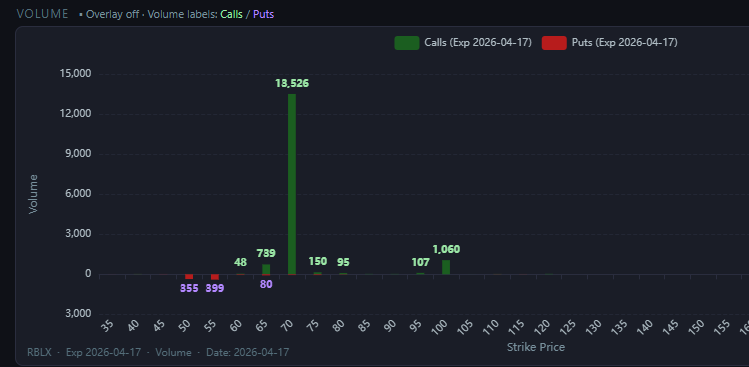
Model 3 · 模型三 ★
BigCall
Bullish Big Buy Call
看涨大买单 Call
Aggressive large-volume call buying (at ask). OTM calls with Delta 0.30-0.40 — sweet spot for leveraged directional bets.
Detection Pattern
Call ·
OTM ·
Vol/OI ≥ 3.0x
★ Direction: Bullish
Reasoning
Large aggressive call buying at a single OTM strike signals directional conviction. Delta 0.30-0.40 provides maximum gamma exposure (biggest bang for the buck) while being close enough to ATM to have a realistic chance of going ITM. Lower Vol/OI threshold (3x vs 6x) because single-leg buys don't need the same magnitude as spreads.
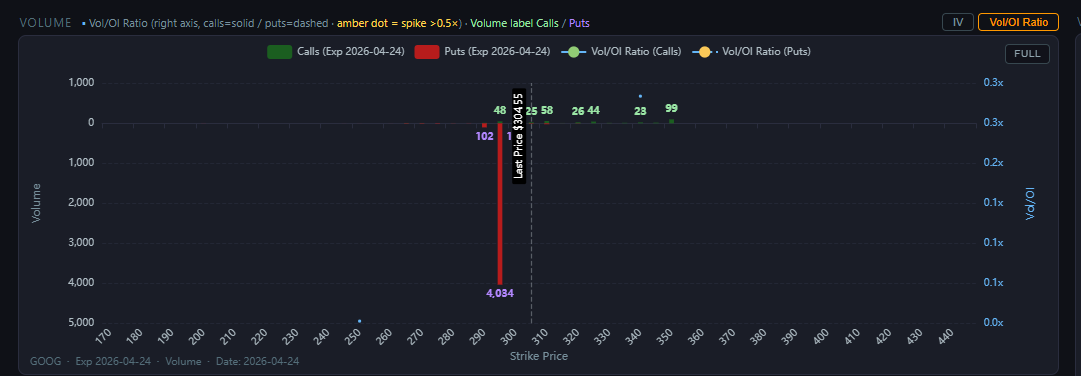
Model 4 · 模型四 ★
SellPut
Bullish Big Sell Put
看涨大卖单 Put (卖出看跌期权)
Aggressive large-volume put selling (at bid). Last price above strike — selling ITM or ATM puts to collect premium, bullish conviction.
Detection Pattern
Put ·
ITM_or_ATM ·
Vol/OI ≥ 4.0x
· Premium ≥ $2.5
★ Direction: Bullish
Reasoning
Selling puts aggressively at bid (below midpoint) signals strong bullish conviction — the seller is willing to buy the stock at the strike price. High premium (≥$2.50) ensures meaningful income. Zero OI common because this is often a brand-new position. Shorter DTE (1w-2mo) because put sellers want faster theta decay.
Delta Curve — Market Maker Position Indicator
New
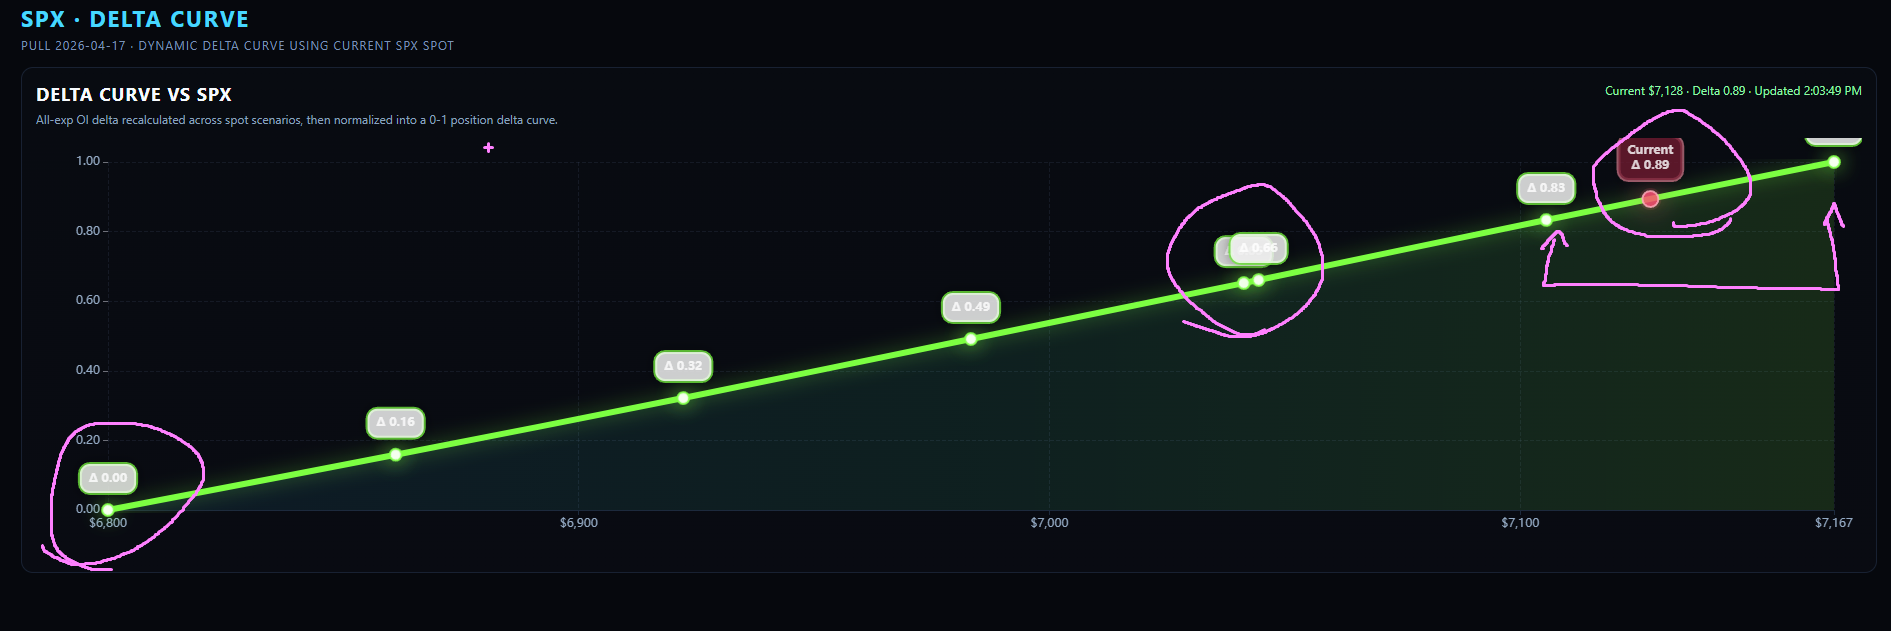
Delta Curve vs SPX ★
Dealer Aggregate Delta Exposure
The delta curve shows where current price sits on the aggregate option chain delta structure,
measured between -GEX support (downside boundary) and +GEX target (upside boundary).
Prediction
High (> 0.65): Dealers call-exposed — resistance ceiling strong. Bearish lean.
Mid (0.35–0.65): Balanced.
Low (< 0.35): Dealers put-exposed — upside amplification. Bullish lean.
★ Engine: Delta Curve
Mid (0.35–0.65): Balanced.
Low (< 0.35): Dealers put-exposed — upside amplification. Bullish lean.
Reasoning
When dealers are at max call exposure (high position delta), small selling pressure triggers larger unwinds.
When max put-exposed (low), upward moves force share buying to hedge, amplifying upside.
Macro Market Breadth & Cross-Asset Regime
New
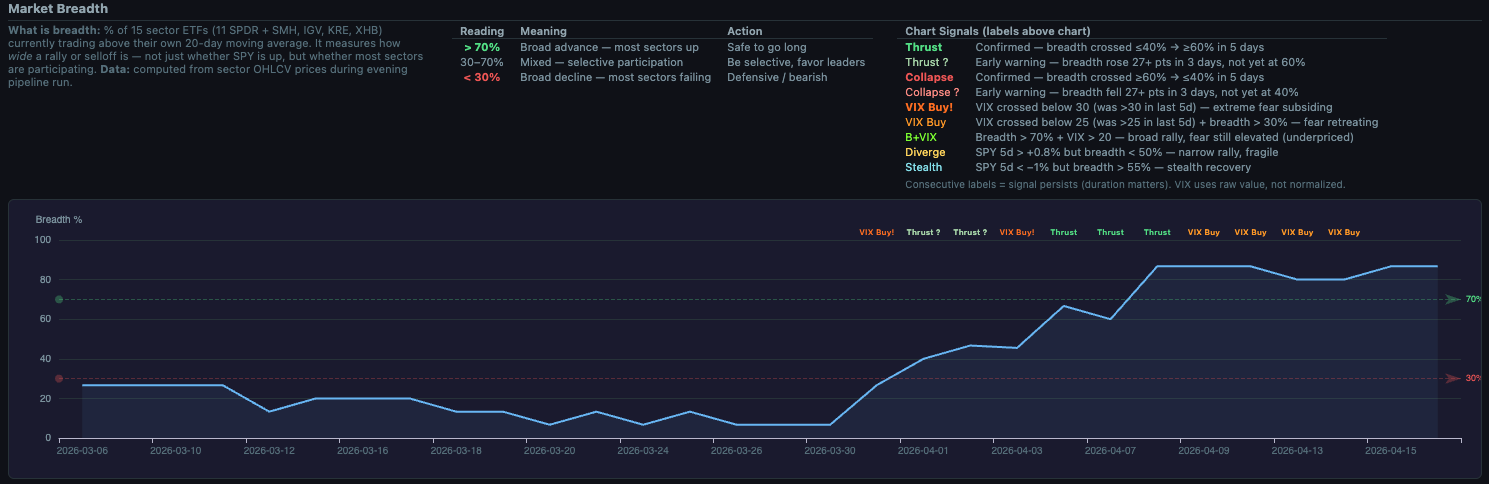
Market Breadth Signals ★
Market Breadth & Cross-Asset Regime
Market Breadth measures % of 15 sector ETFs above 20-day SMA.
Cross-Asset Regime classifies SPY × VIX × GLD direction into 8 types.
Prediction
Thrust: Breadth ≤40% → ≥60% in 5d. Bullish.
Collapse: Breadth ≥60% → ≤40% in 5d. Bearish.
VIX Buy: VIX crossed below 30. Bullish, high win rate.
★ Engine: Macro
Collapse: Breadth ≥60% → ≤40% in 5d. Bearish.
VIX Buy: VIX crossed below 30. Bullish, high win rate.
Reasoning
Narrow rallies (SPY up, breadth <50%) are fragile. Broad advances (breadth >70%) provide durable support.
VIX crossing below 30 = panic fading, historically highest win rate.
Gamma Support Reclaim (SP-1) — Dealer Stabilizing Zone
New
The zone between the GEX flip strike and the top positive GEX level (+GEX#1).
When price is inside this region, dealers are long gamma — they mechanically buy dips and sell rallies,
creating a stabilizing floor and ceiling. This is the "safe zone" for dip-buying.
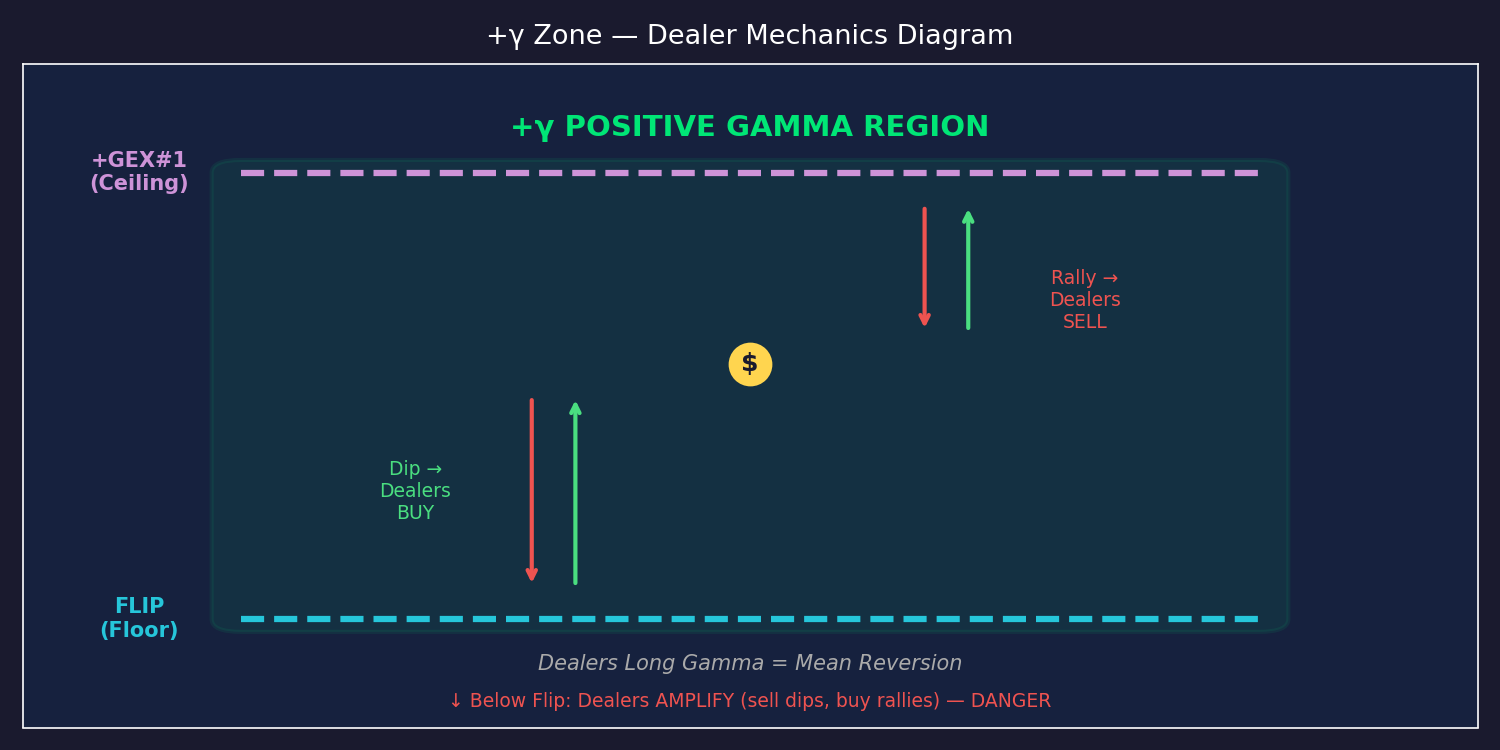
+γ Zone · Flip Bounce ★
Positive Gamma Region (Flip → +GEX#1)
正伽马区域 — 做市商稳定带
Price is between flip ($F) and top positive GEX level ($G). Net GEX is positive.
Dealers are long gamma — their delta hedging creates mean-reversion pressure.
Dips are cushioned (dealers buy), rallies are dampened (dealers sell) until price breaks out.
Prediction
When price enters from below (bounce off flip): expect snap-back toward +GEX#1 (magnet).
Typical magnitude 3–6% in 1 day. Dealer hedging amplifies the move.
When near +GEX#1 (top of zone): expect resistance, mean-reversion back toward center.
★ Engine: +γ Region
Reasoning
Dealers long gamma = mechanically stabilizing. Delta hedging BUYS shares on dips (pushes price up)
and SELLS on rallies (caps upside). The zone acts as a "gravitational field" pulling price toward
the gamma concentration peak. Width of zone indicates stability: narrow = compressed spring
(sharp moves when price exits), wide = gentle magnet (slow grind toward center).
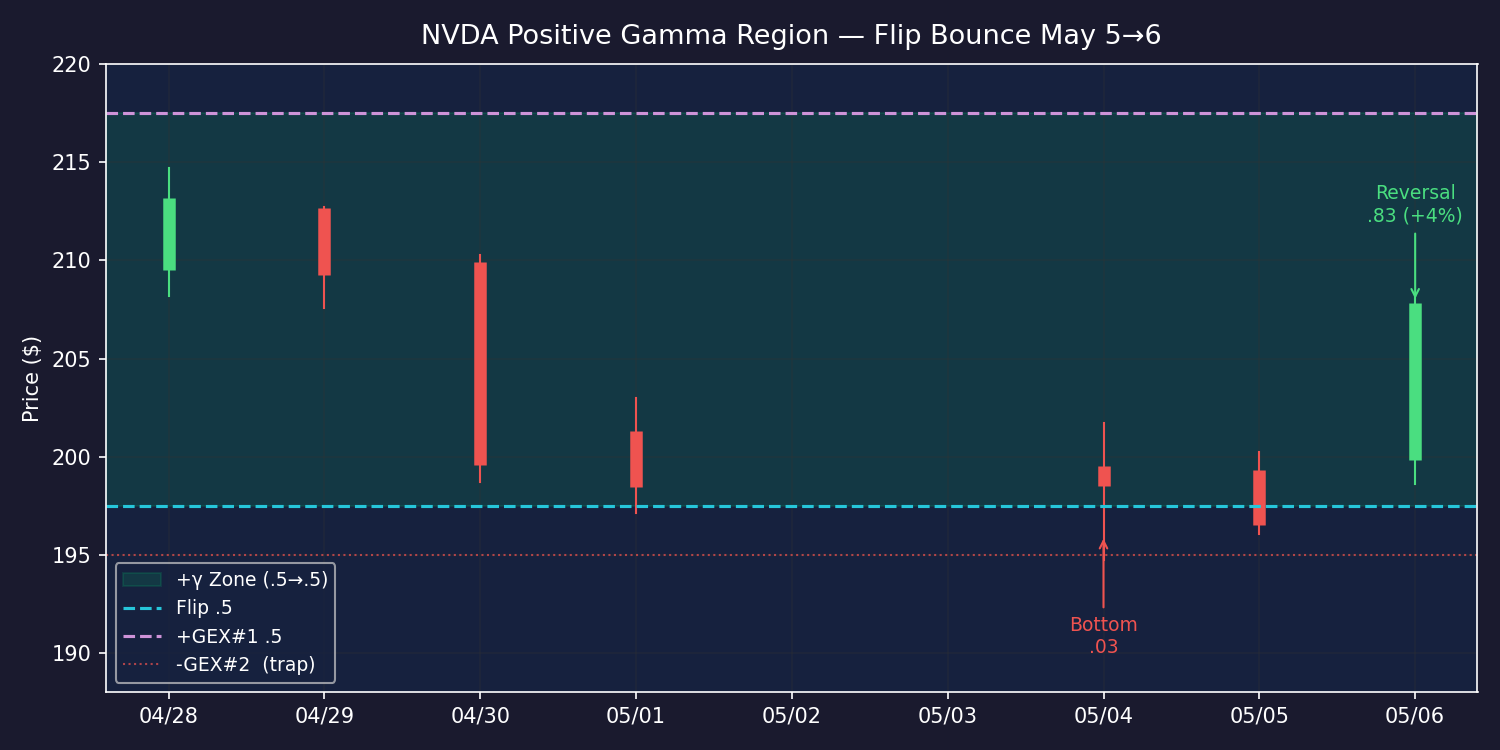
Case Study · NVDA May 5–6 ★
NVDA Flip Bounce — $196→$208 (+6%)
Apr 30: NVDA crashed from $210→$199 (broke max gamma). May 1–5: price drifted to $196, testing flip at $195.
Gamma squeeze active, all three greeks bullish, VIX peak reversal, extreme call PCR.
May 6: price entered +γ zone and snapped to $208 (+4% in 1 day), pulled toward +GEX#1 at $217.5.
Key Signals at Bottom
gammaSqueeze = True (compressed GEX above price)
nearFlip = True (price 0.5% from flip)
allThreeBullish = True (GEX+, DEX+, VEX+)
macroVixPeakReversal = True (fear exhaustion)
oiFlow = call_building (institutional bid)
pcrExtremeCall = True (P/C vol 0.17)
★ Engine: +γ Region + γSqz
nearFlip = True (price 0.5% from flip)
allThreeBullish = True (GEX+, DEX+, VEX+)
macroVixPeakReversal = True (fear exhaustion)
oiFlow = call_building (institutional bid)
pcrExtremeCall = True (P/C vol 0.17)
Why It Worked
Flip held as support → price re-entered positive gamma region → dealer hedging amplified the bounce.
The +GEX#1 at $217.5 acted as a magnet. Width of zone ($195→$217.5 = 11%) meant explosive move once
price crossed the flip boundary. Multi-factor confirmation (squeeze + VIX reversal + call flow)
distinguished this from a dead-cat bounce.
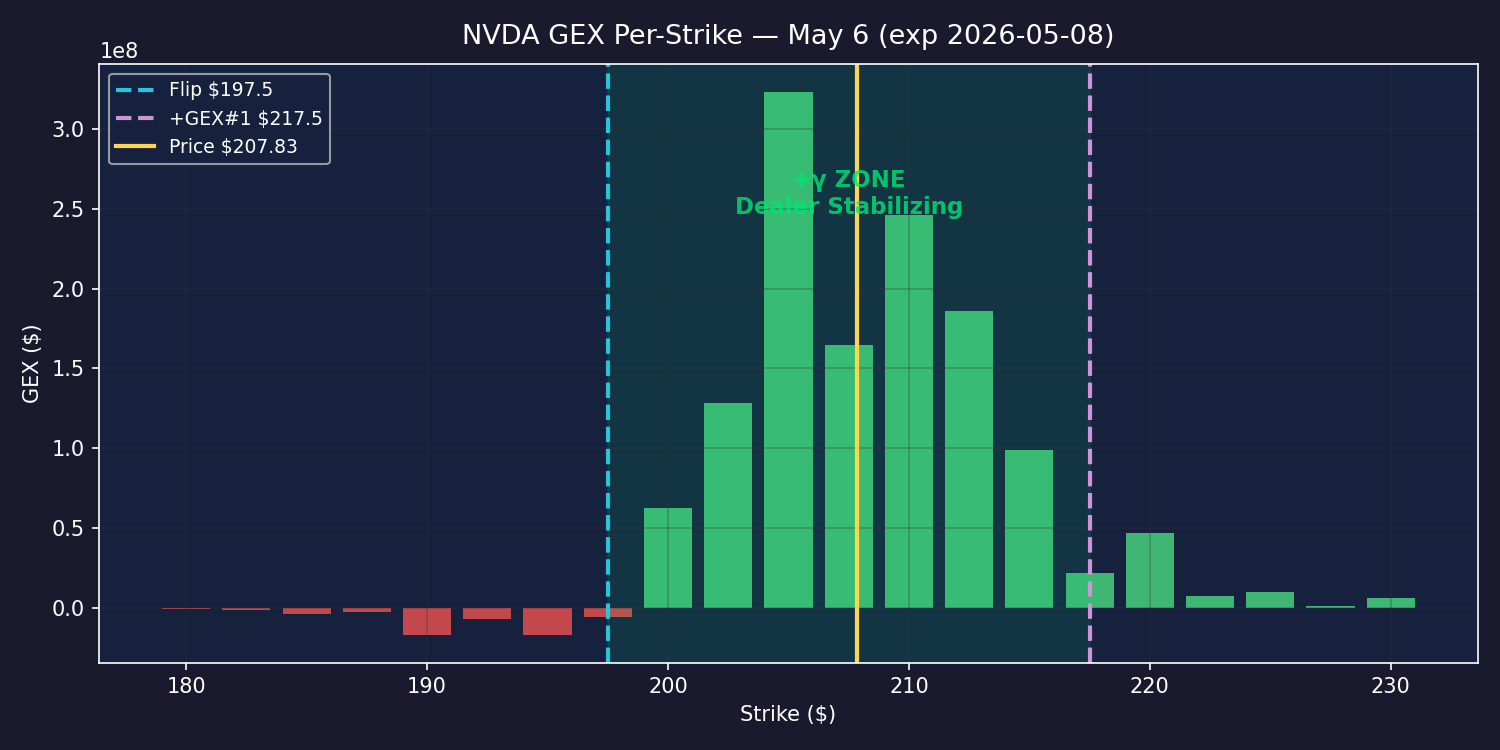
GEX Structure · May 6
GEX Per-Strike — Zone Highlighted
Massive positive GEX between $200–$215 (the +γ zone). Price at $208 sits in the heart of dealer stabilization.
Negative GEX only below $195 (small). The zone width ($197.5→$217.5 = 9.6%) is wide — gentle magnet, not a spring.
Implication
Wide +γ zone = price can oscillate freely inside. The zone floor (flip $197.5) and ceiling (+GEX#1 $217.5)
are the key levels. Trade direction: mean-revert within zone, trend-follow if zone breaks.
Reading
Green bars dominate above flip → dealers buy any dip toward $197.5. Red bars tiny → limited downside acceleration.
This is the highest-conviction dip-buy setup: wide +γ zone, concentrated positive GEX, all greeks aligned.
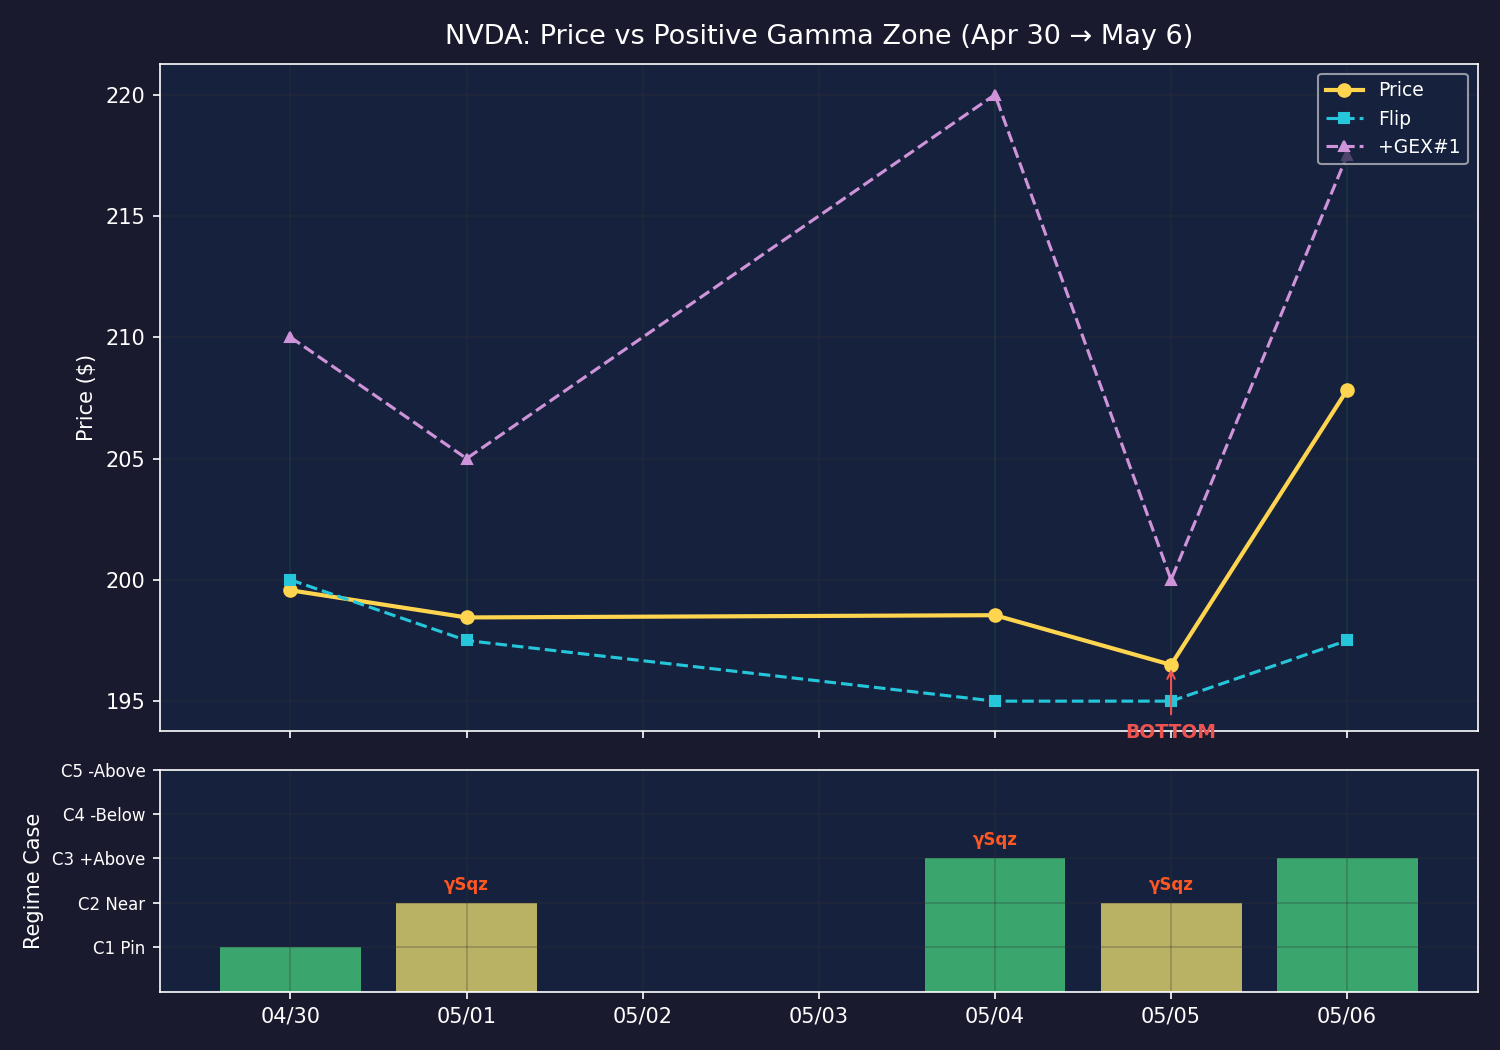
Regime Evolution · Apr 30→May 6
Multi-Day Regime Transition
Apr 30: C1 Pinned → May 1: C2 Near-Flip (γSqz active) → May 4: C3 +Above (γSqz) →
May 5: C2 Near-Flip again (γSqz, BOTTOM) → May 6: C3 +Above (reversal).
Flip level descended from $200 to $195 then back to $197.5, tracking the sell-off.
Pattern
C2 (near-flip) + γSqz = inflection point. The regime oscillated C2↔C3 during the base-building phase.
Final C2→C3 transition on May 6 = confirmed re-entry into stabilizing regime = buy signal.
Key Takeaway
Watch for C2→C3 regime transition with gamma squeeze active. The +GEX#1 line (purple) acts as a magnet
once price re-enters the +γ zone. The zone width expansion on May 6 (flip dropped to $197.5, +GEX#1 rose to $217.5)
signaled the market expected a wide stabilizing range — bullish for the reversal.